State of Our Data 2026
ABOUT THE INSTITUTE AND DATA TRUST
The Charlotte Urban Institute and the Regional Data Trust equip changemakers with data and information that makes a difference in people’s lives. Established by the state legislature in 1969 to serve our urbanizing region, the Institute is the Charlotte region’s applied research and community outreach center. We engage expertise across a diverse set of disciplines and life experiences to curate data and conduct actionable research and policy analysis to convene and equip community members, nonprofit organizations, local leaders, local governments, educators and more. The Institute serves a 14-county region that consists of Anson, Cabarrus, Catawba, Cleveland, Gaston, Iredell, Lincoln, Mecklenburg, Rowan, Stanly and Union counties in North Carolina; as well as Chester, Lancaster and York counties in South Carolina.
The Data Trust, formed in 2004, is a community-university partnership that links data across service and organizational silos to provide information our community can act on. The Data Trust is a 501(c)(3) and a university-affiliated entity. It is governed by a board of community and university partners, and staffed by the Institute. In addition to fiduciary responsibilities over the data, the board guides the strategic priorities of the Institute. Together, the Institute and Data Trust connect the resources of Charlotte’s public research university to the richness of our local and regional communities, and provide information and infrastructure our communities can use.
For more information, visit ui.charlotte.edu/.
Report Contact: Asha Ellison, director of research translation and engagement
Authorship and Suggested Citation:
Idzikowski, S., Occhipinti, N., Edwards, C., Venkitasubramanian, K., Ellison, A. and Thomas, M.L., (2026). State of Our Data. Charlotte, NC: UNC Charlotte Urban Institute and Charlotte Regional Data Trust. https://ui.charlotte.edu/state-of-our-data/.
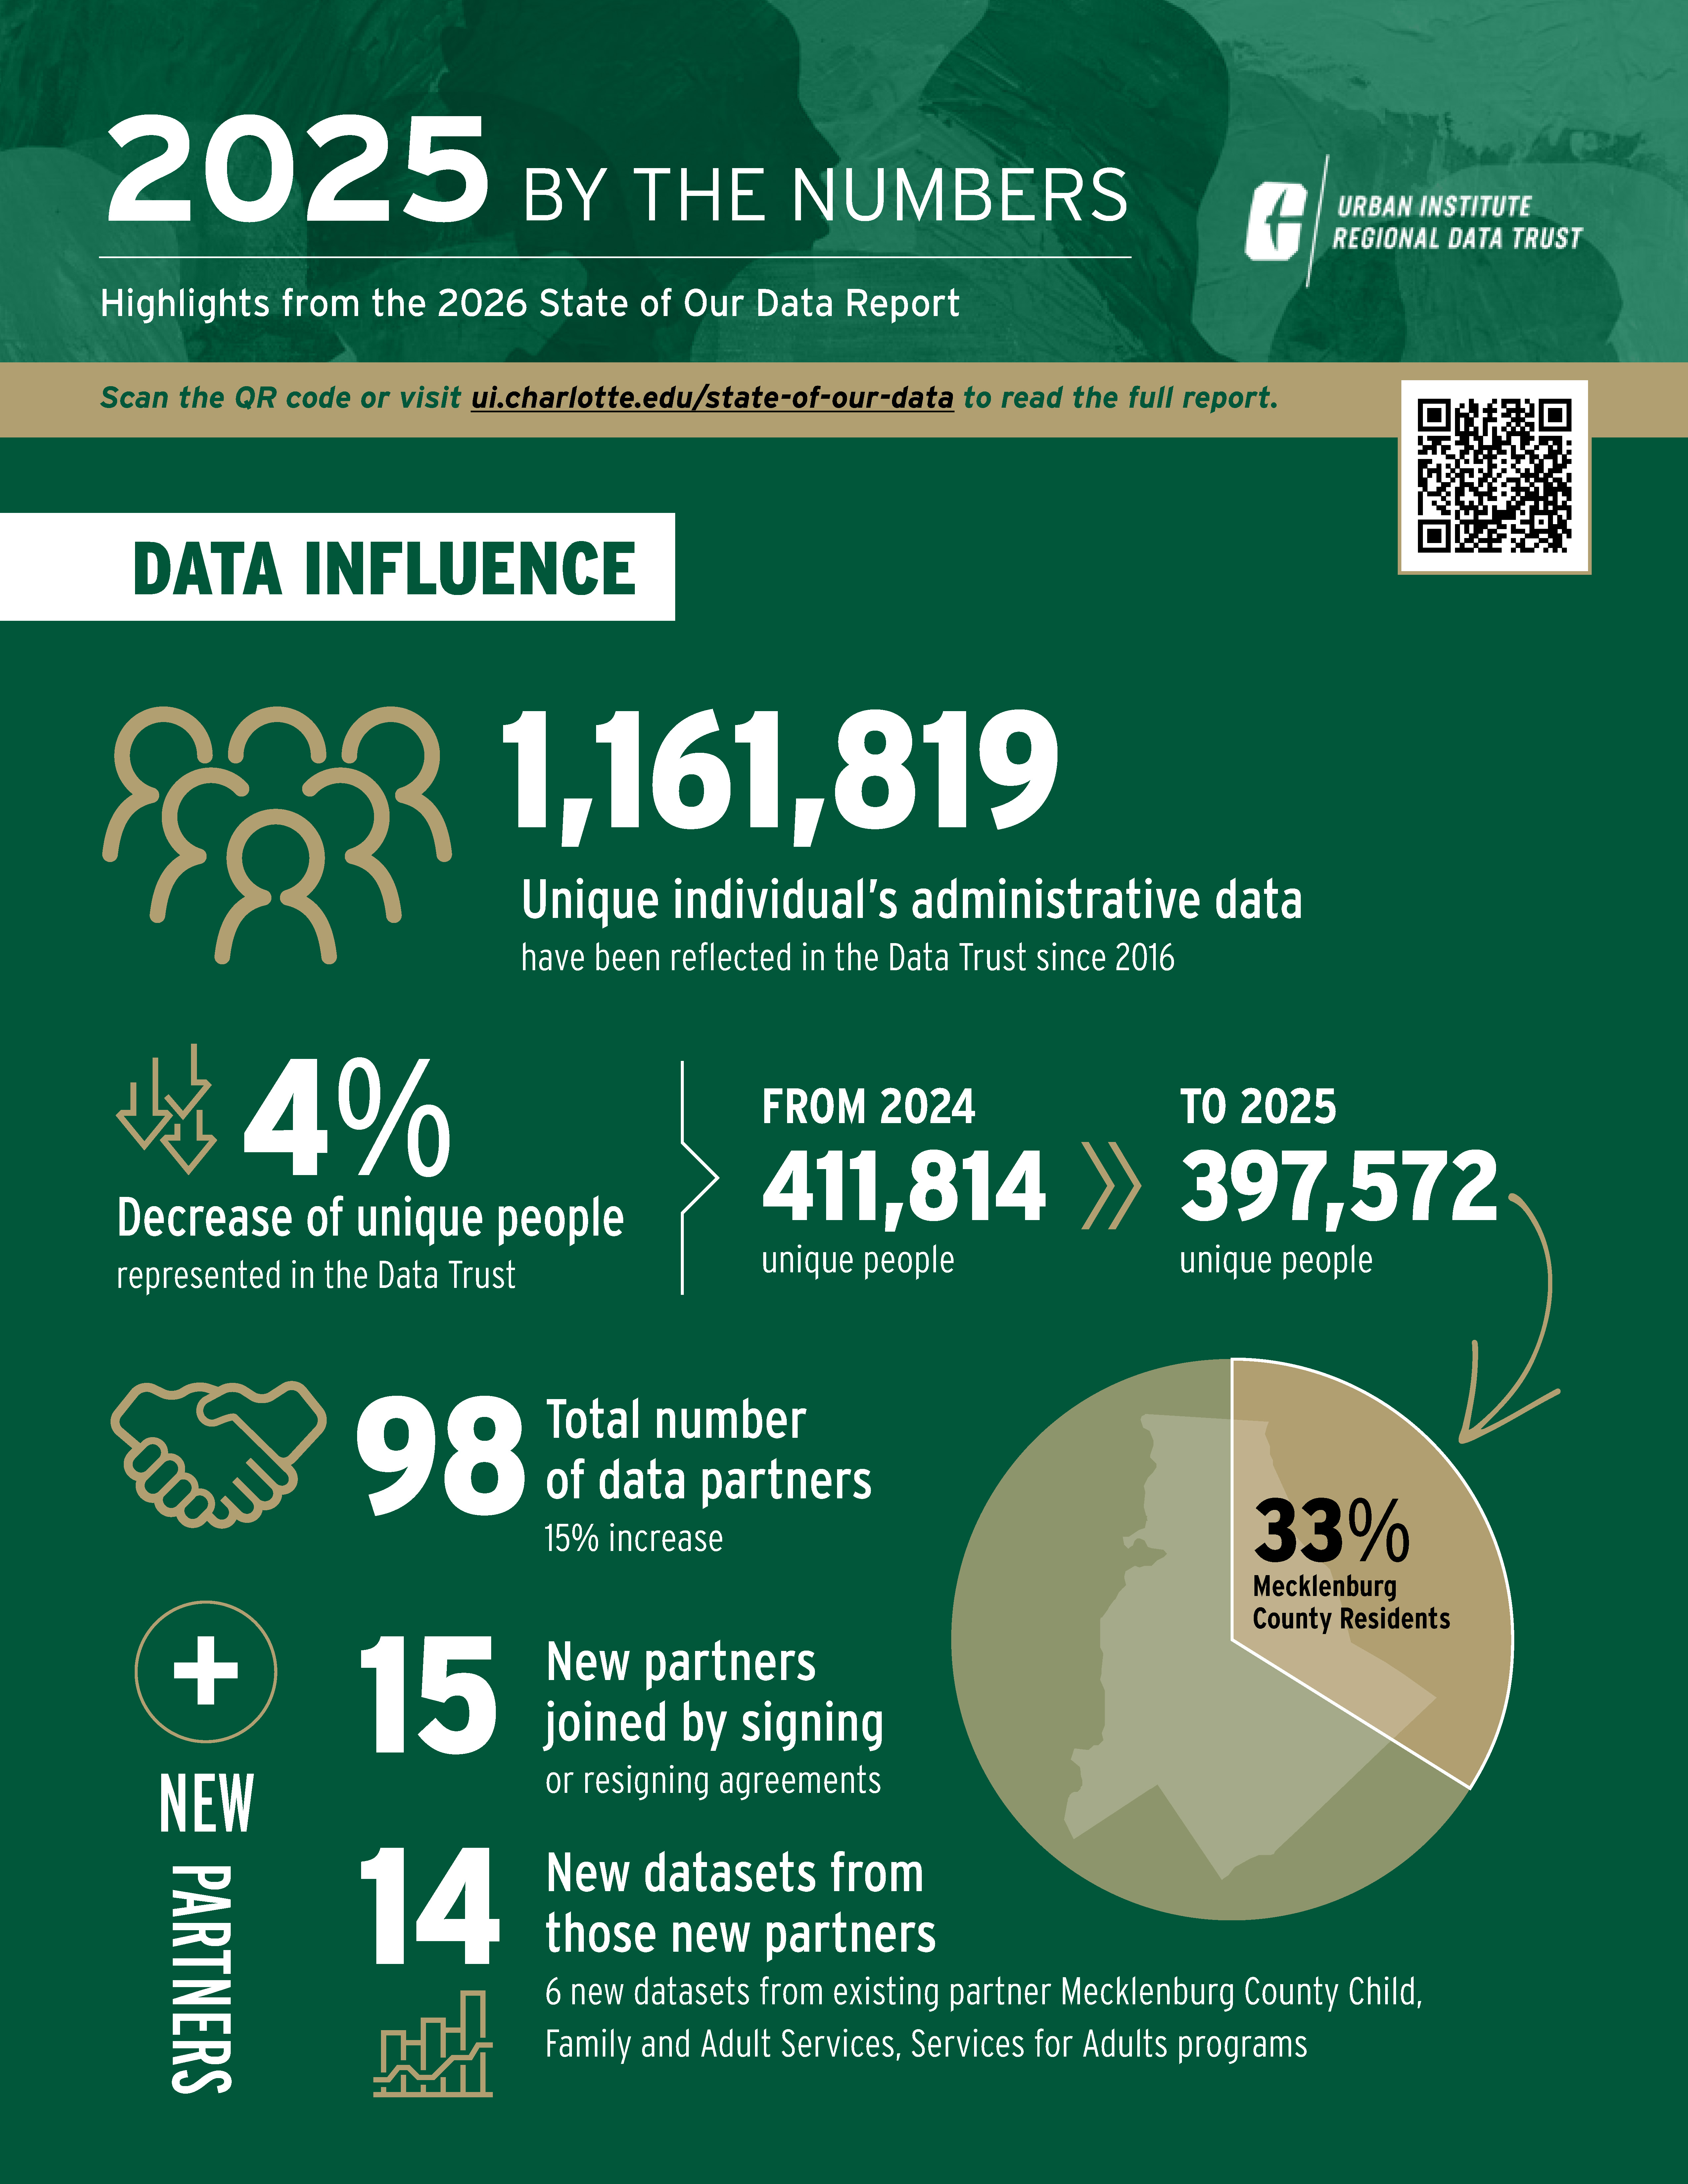
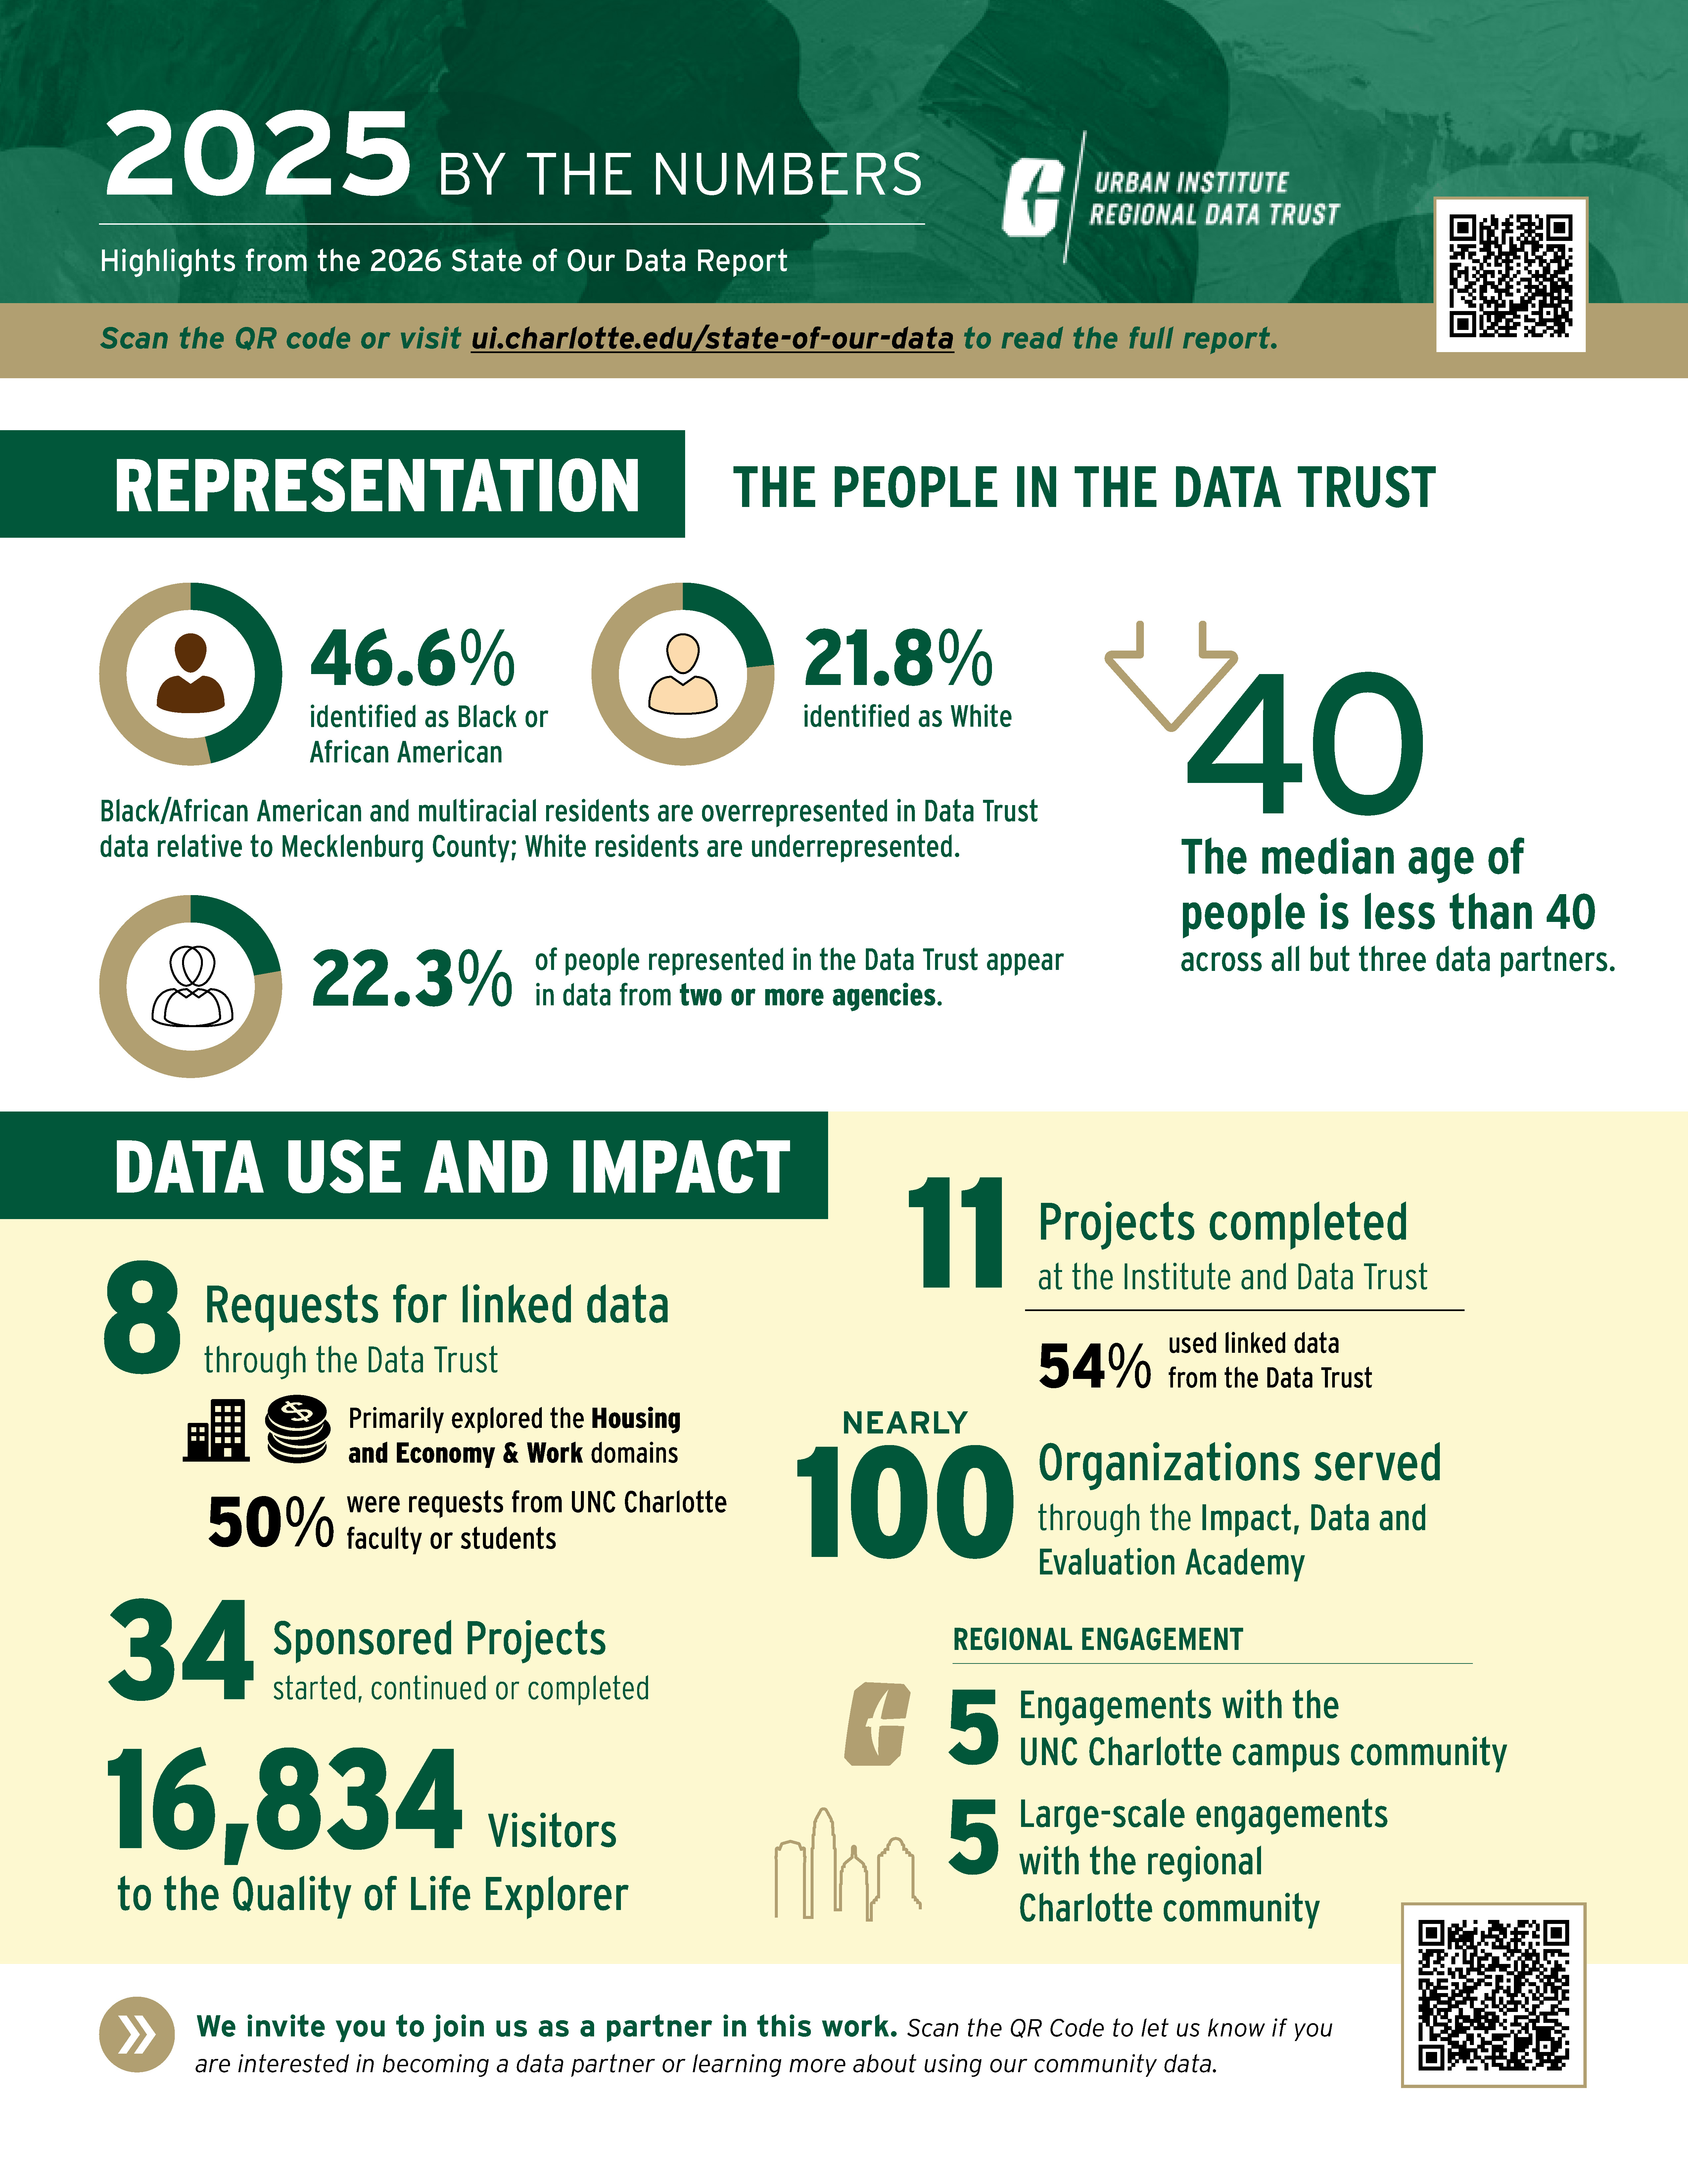
2025 By the Numbers
OUR BOARD AND STAFF
Charlotte Regional Data Trust Board of Directors: https://ui.charlotte.edu/charlotte-regional-data-trust-board/
Institute and Data Trust Staff: https://ui.charlotte.edu/about-us/staff/
LETTER FROM THE BOARD PRESIDENT AND EXECUTIVE DIRECTOR
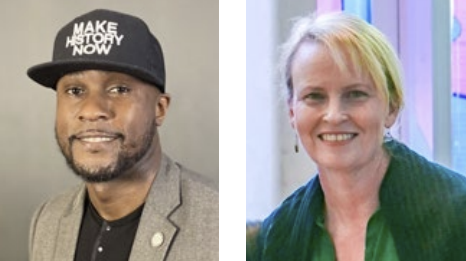
Our central work at the Data Trust is to maintain and build trust around use of community data. The State of Our Data report informs our Board of Directors and the broader public, describing the data that we hold in trust and use for community benefit. It serves as our annual report and key transparency tool, helping us more clearly understand what we do and how we do it.
There is much to highlight and celebrate in the calendar year 2025. Our integrated administrative data system continues to hold about 1.1 million unique individuals from the Charlotte region (2016-2024). And our Explorer tools provide public access to 140 variables, 80 variables for 458 Charlotte-Mecklenburg neighborhoods, and 65 variables for 752 census tracts in our 14-county North and South Carolina region - ready resources for residents and decision-makers.
As excited as we are about our growth, we know the greatest value of our data is not simply in what it tells us, but in how it is used, the impact it creates, and particularly whether the people and communities represented in the data benefit from its use. In 2025, we marked the appointment of the first members of our Community Data Oversight Committee , a committee composed of community members whose lived experiences are represented within our integrated administrative data. CDOC helps ensure that community voice and lived experience inform the questions we ask, how we understand what the data reveals, and how research about communities returns to communities in ways that are accessible, useful, and actionable. Ultimately, CDOC’s goal is not simply to produce better data or better research, but to ensure that data becomes a community resource; one that strengthens understanding, informs better decisions, builds trust, and helps communities shape their own futures.
We also celebrated the first course of the Impact, Data and Evaluation Academy to build non-profit capacity in data management and evaluation. Over the course of the year, IDEA worked with 96 organizations. And we launched a training initiative with our Charlotte-Mecklenburg Libraries, training librarians to train patrons on using the Charlotte-Mecklenburg Quality of Life Explorer. We continue to build the ways we focus on use, impact, and community benefit.
We are grateful to the many people it takes to build and sustain a trusted community data infrastructure - our board, our committees, our donors, our staff, our data and research partners, and especially, the people in the data.
Jamaal Kinard, President
Charlotte Regional Data Trust Board of Directors
Lori Thomas, Executive Director
Charlotte Urban Institute and Regional Data Trust

INTRODUCTION
The State of Our Data report describes the Institute and Data Trust’s data and its use. The report provides our board of directors, our communities, partners and stakeholders with an annual update and summary of our community data ecosystem, the data we hold in trust and why it matters. This third annual report reflects the calendar year 2025.
In legal terms, a trust is an arrangement where a person or entity holds an asset on behalf of a designated beneficiary. At the Institute and Data Trust, we hold data for our partners, for community benefit – especially for those who are represented in the data. The “Our” in the State of Our Data is purposeful and inclusive. We recognize that the integrated data we hold does not “belong” to the Institute and Data Trust or the University. It is a public good.
Trust is also the essential work of this community asset. We prioritize building and maintaining trust with all of our stakeholders - people in the data, organizations and institutions that collect and share the data, decision-makers who put it to use, and the researchers, analysts and people with lived expertise who help make sense of its patterns and anomalies.
How We Use the Report
The State of Our Data report is an accountability and decision-making tool for the Charlotte Regional Data Trust Board of Directors. We use annual information about who is in our data to inform representation on the Board and its committees. We use it to guide our communication and dissemination strategies. The report also helps us monitor the extent of data coverage across key quality of life domains and across our region, as well as how the data has been used and the impact of that work. It provides a public record of how our community data ecosystem is continuously growing and evolving to better meet the needs of our communities. This annual report also serves as an ongoing assessment of who and what is missing in our data and the success of strategic efforts to create a more comprehensive and representative resource.
This report is one of the ways we practice transparency in our work and honor the investment of UNC Charlotte, our donors and, particularly, our communities, whose lives are represented in our data and whose quality of life we seek to ensure. Trust requires transparency.

OUR COMMUNITY DATA ECOSYSTEM
To create a city and region where everyone thrives, the Institute and Data Trust nurtures and maintains a community data ecosystem that addresses quality of life domains, ensures adequate data infrastructure and engages people and partners. The size of each quality of life domain represents the number of data partners contributing to the Charlotte Urban Institute and Data Trust.
Quality of Life Domains
The Institute and Data Trust work across nine interconnected domains that influence quality of life and thriving at individual, organizational and community levels. We continuously seek new data sources and conduct applied research to help us and our communities better define and understand these arenas.
The domains are:
- Education: Teaching and learning from pre-K through higher or vocational education.
- Economy and Work: Wealth, resources and the means to attain them.
- Environment: Natural and built surroundings including air, water and infrastructure.
- Health, Mental Health and Well-being: Biological, psychological, social and spiritual wellness across the lifespan.
- Housing and Homelessness: The dwellings and neighborhoods where people reside and live their lives.
- Justice and Safety: Fairness, accountability and access to legal protection, including child welfare.
- Transportation: Movement within and across communities, the city and the region to meet individual and collective needs.
- Arts and Culture: Creative expression and communal values, tradition and heritage.
- Engagement: Participation in communities and collective processes.
Data Infrastructure
Our community data infrastructure supports understanding and improving these nine domains for everyone’s benefit and includes the data tools and training we provide, as well as the services, technology, policies and practices that ensure access, security, ethical use and impact. Key tools of our infrastructure include:
- The Data Trust’s integrated administrative data system1 that links the individual-level administrative data of more than 60 partners across organizational silos.
- The Charlotte-Mecklenburg Quality of Life Explorer,2 a partnership with the City of Charlotte, Mecklenburg County, and the towns of Cornelius, Davidson, Huntersville, Matthews, Mint Hill and Pineville, provides data on more than 80 variables for 462 neighborhoods in Charlotte-Mecklenburg.
- The Carolinas Regional Explorer, currently in beta testing, provides data similar to the Quality of Life Explorer for the 14-county Charlotte region. The Regional Explorer adds analytic capacity and the ability to explore context and related data stories.
- The public opinion survey center includes a regional well-being and quality of life survey and an omnibus survey that allows partners to buy one or more questions. This reduces the typical cost of a representative survey for participating partners.
- The Impact, Data and Evaluation Academy,3 also known as IDEA, provides training and skill-building so people can put data and information to use in their organizations and communities.
- Technical Assistance contracts like the Transportation Management Information System4 is an ongoing statewide project that maintains and improves efficiency in state public school bus transportation at the district level. TIMS Support Staff at North Carolina State University and UNC Charlotte provide daily software and technical support to individual TIMS data managers across the state.
People and Partnerships
The strength of our infrastructure is dependent on the people and partners who contribute data, expertise, context, join us in research and engagement, and put the infrastructure to work for our communities and region. There are many hands that shape our work and we highlight key stakeholder groups below.
- Board of Directors and Committee Members. The Data Trust Board maintains responsibility over the data held by the Data Trust, and different aspects of organizational and data governance are managed by our committees: the Executive Committee, the Data and Research Oversight Committee, the Data and Technical Advisory Committee and the Community Data Oversight Committee.
- Data Partners. Our tools are dependent on data partners who prepare and share their data and work with us to support, use and maintain legal and ethical data practices. Our data partners and sources are listed in Figure 1.
- Data Users. Community, faculty and staff researchers turn the data available through the Data Trust’s web portal and Explorer tools into information our community can use.
- UNC Charlotte Partners. The Institute is a unit of UNC Charlotte’s Division of Academic Affairs and the Data Trust is a 501(c)(3) affiliated entity of the University. Faculty, staff, students, and the divisions of Academic Affairs, Advancement, Legal Affairs, OneIT and Research are key internal partners in our ongoing work.
- Funders and Project Sponsors. Funders and community organizations of every size contribute to the work of the Institute and Data Trust.
In 2025, we grew our participatory governance. We recruited the first group of Community Data Oversight Committee members and began meeting with the group on a regular basis to establish and work towards goals and objectives. CDOC is a committee of the Board of Directors that is comprised of 11 people who are represented or overrepresented in Data Trust data. The State of Our Data Reports informed committee recruitment.

Our Data
This section describes two key data sources at the Institute and Data Trust: (1) the spatial variables used for the Quality of Life Explorer and the emerging Carolinas Regional Explorer, and (2) annual deposits of administrative data into the Data Trust’s integrated data system. Additional details on data, methods and analyses are available in Appendix A.
Figure 1 describes the data sources by quality of life domain for the Quality of Life Explorer, Regional Explorer and the Data Trust’s administrative data system. The size of each quality of life domain represents the number of data partners contributing to the Charlotte Urban Institute and Data Trust. We have the most extensive data coverage in the housing and homelessness domain, followed by economy and work. Arts and culture represents the domain with the lowest amount of data coverage, and we continue to expand these partnerships.
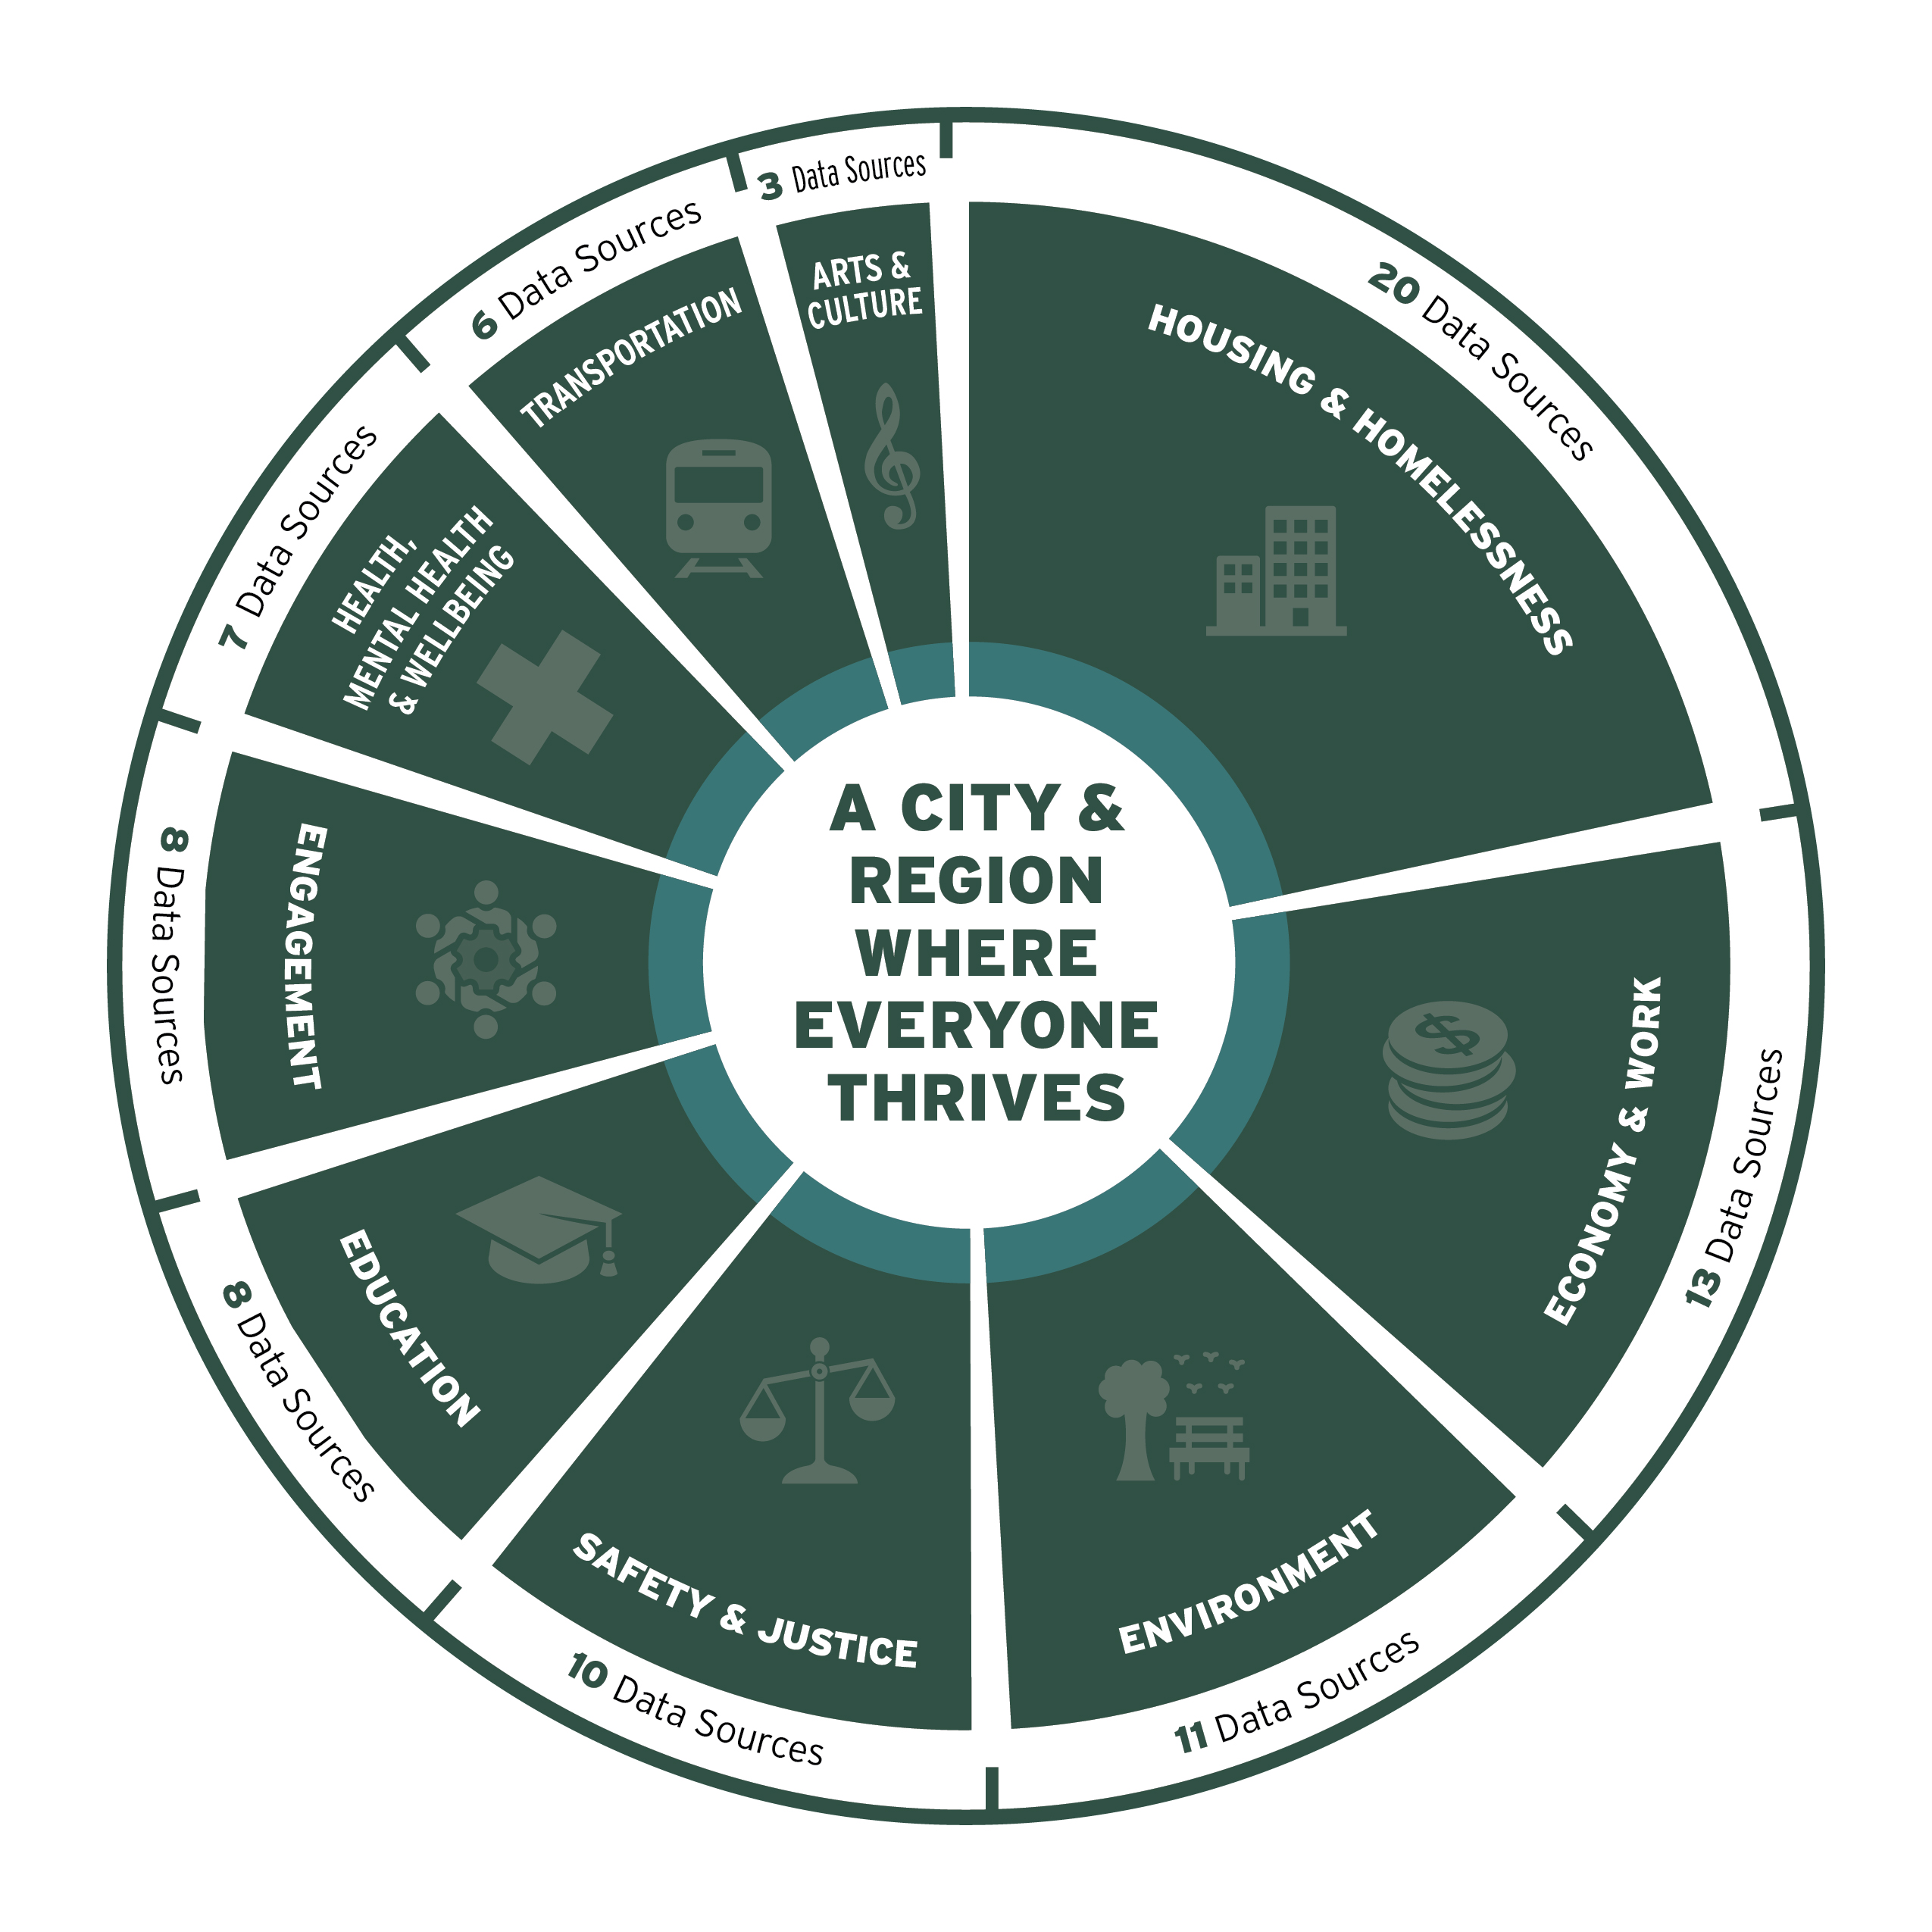
Figure 1 - Our Community Data Infrastructure
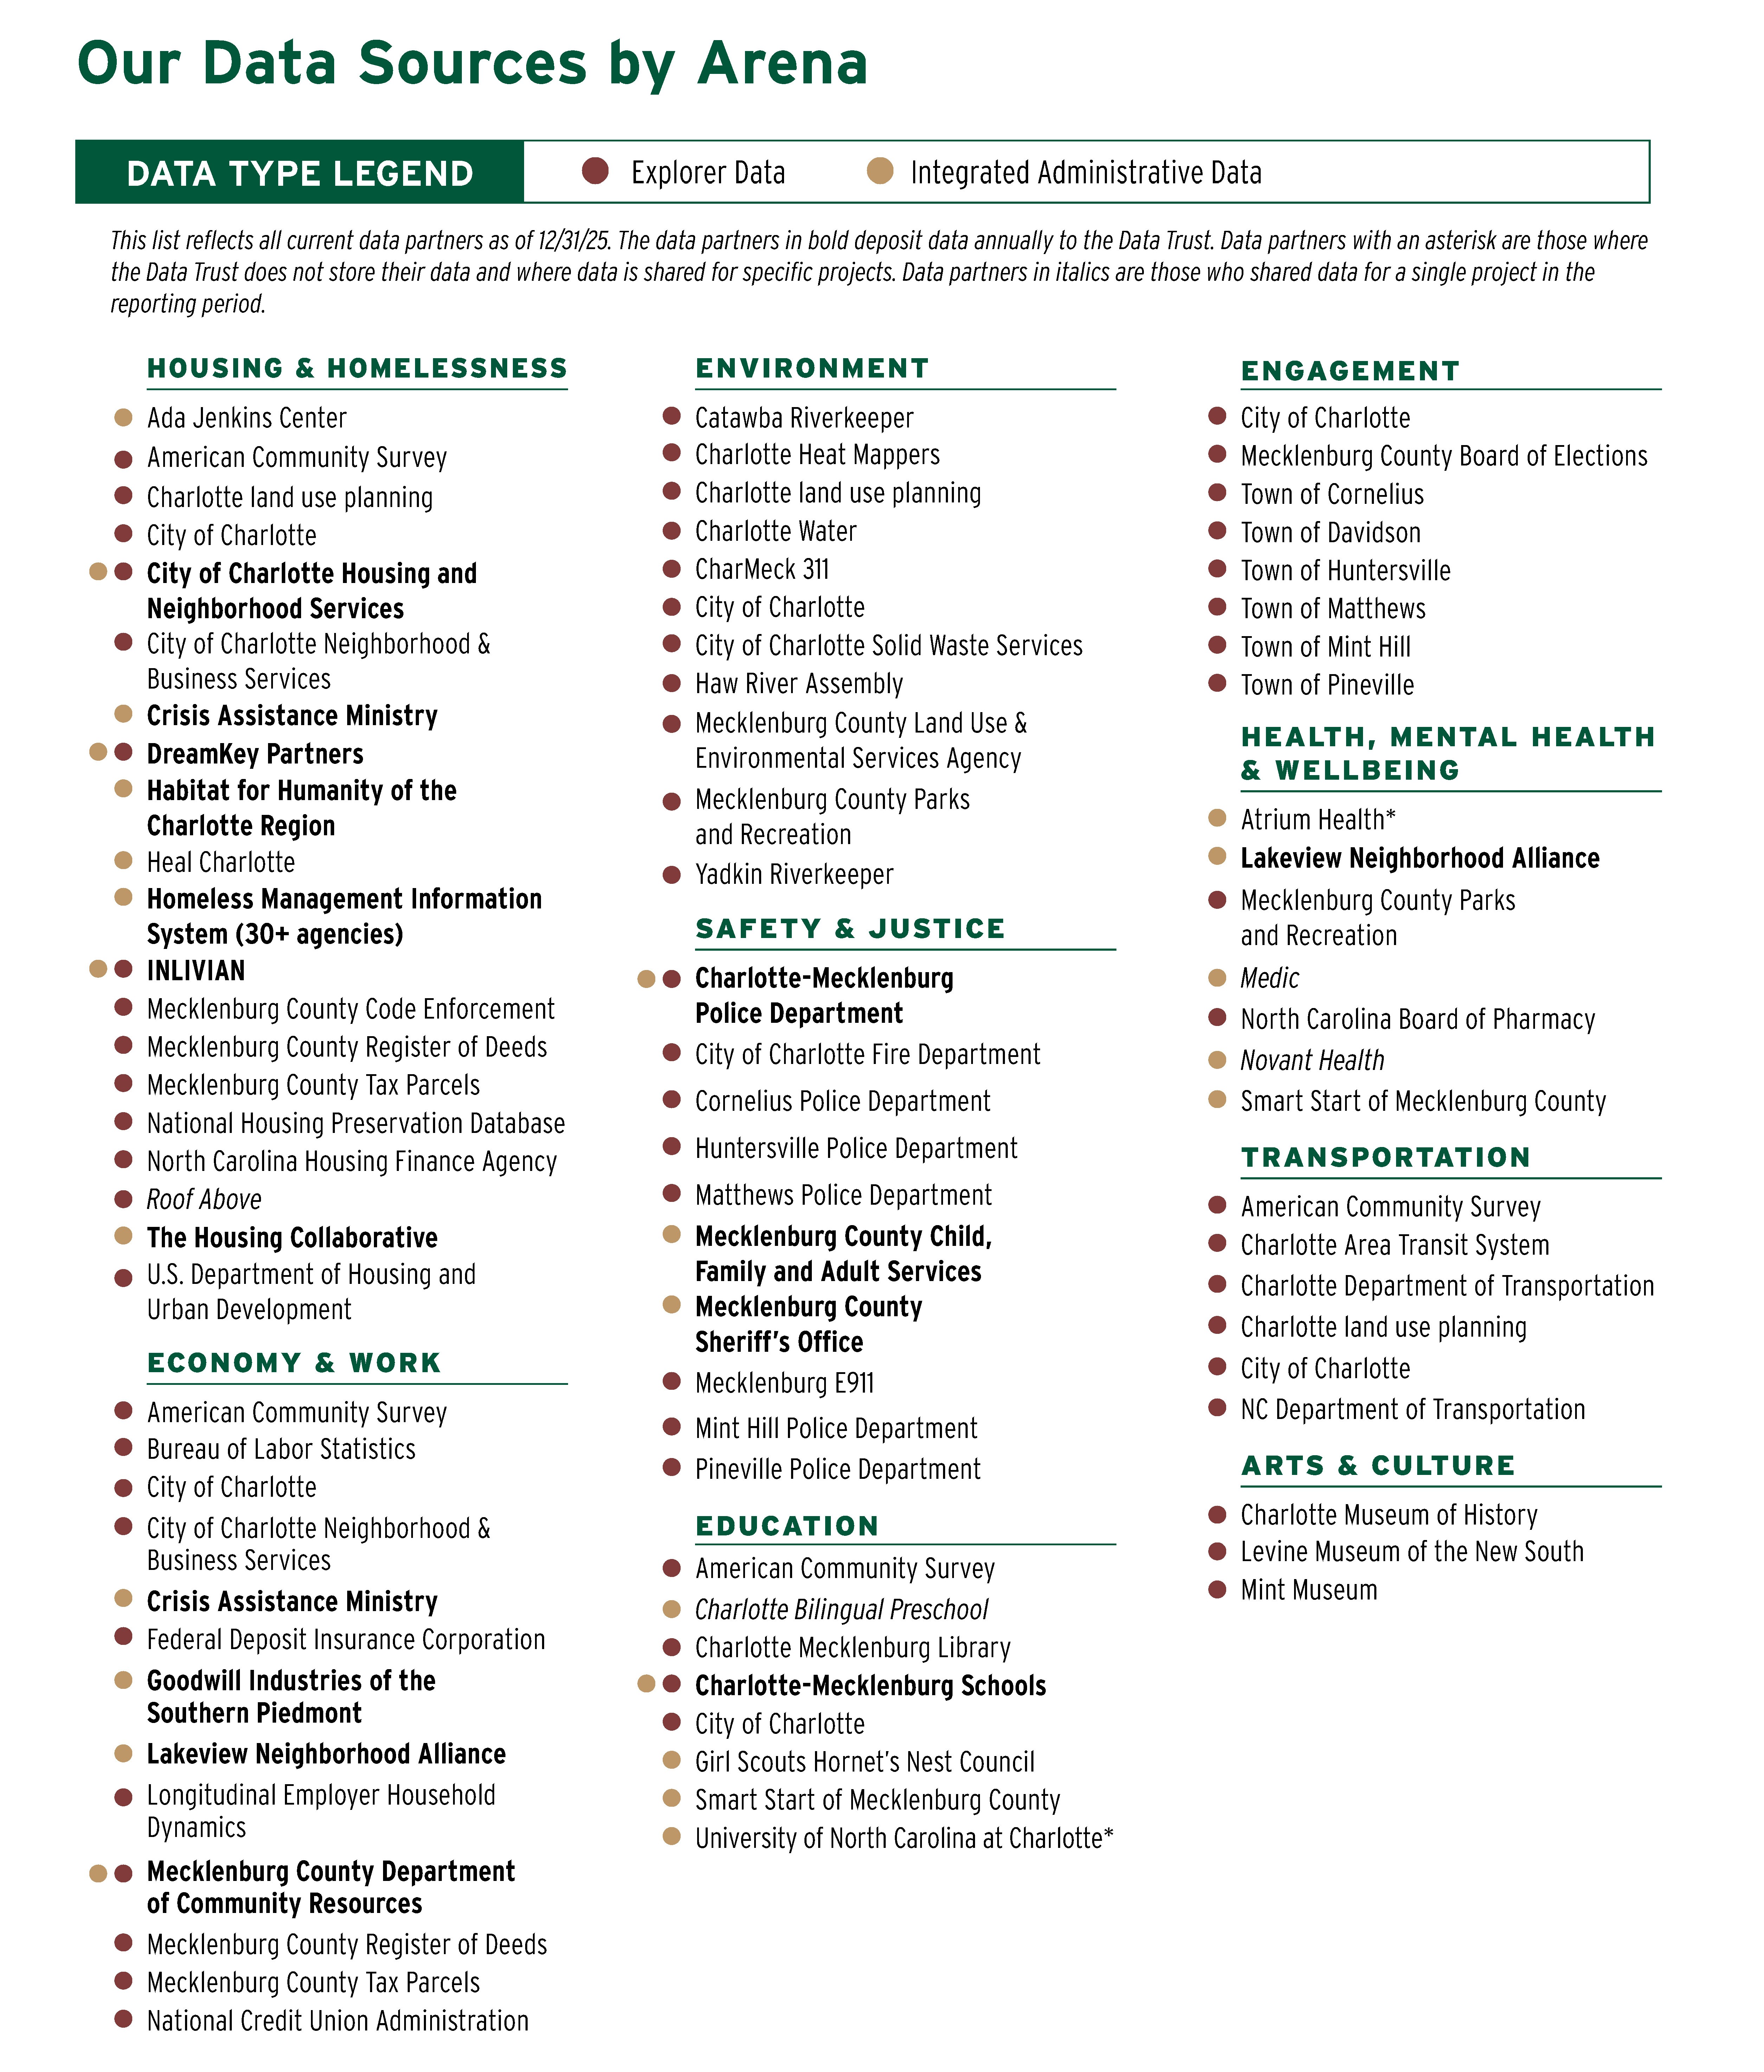
Explorer Data
The focus of our communities’ Explorer data is on place. The Charlotte-Mecklenburg Quality of Life Explorer and emerging Carolinas Regional Explorer use data from multiple sources to map quality of life-related data across counties, towns and neighborhoods. These data help us understand our own spaces and places, but also help us see patterns – areas where we are thriving together, or areas where we have work to do – to ensure everyone can share in the prosperity of our city and region.
The Quality of Life Explorer focuses on Charlotte-Mecklenburg neighborhoods called Neighborhood Profile Areas. NPA boundaries were determined using census block boundaries informed by conversations with neighborhoods conducted by the City, County and University in 2011. While conceptual and practical neighborhood boundaries may change over time, we generally do not adjust the neighborhood boundaries on the map, so that it is possible to observe and compare patterns in the same place over time. The Data Trust incorporates this place-based data that can be linked with administrative data to provide additional neighborhood-level insights.
While neighborhoods are the focus for the Quality of Life Explorer, the Carolinas Regional Explorer, currently in beta testing, displays data at the larger census-tract level across the Institute’s 14-county region. Eventually, and as regional neighbors express interest, the Institute can work with municipalities, county governments and their residents to create more granular tools like the Quality of Life Explorer. In the meantime, the Regional Explorer will offer an integrated lens on how quality of life in our region changes across place and time.
In 2025, work with the Explorer tools included the following milestones:
- Added Heat Index to the Quality of Life Explorer. Geolocated point data was gathered using car-mounted mobile sensors by community volunteers during an effort led by Charlotte Heat Mappers.
- Initiated concerted efforts to re-establish an arts and culture variable on the Quality of Life Explorer. The Institute and Data Trust worked to establish data sharing partnerships with local museums. Three organizations signed agreements in 2025.
- Conducted training with Charlotte-Mecklenburg Library staff regarding the Quality of Life Explorer so they can serve as an extended public resource for the tool.
- Developed both the back-end and front-facing platform to host the Carolinas Regional Explorer. Development included building out analysis tools to view trends over time and across space, as well as to look at relationships between multiple variables. The Carolinas Regional Explorer will formally launch in fall 2026.
Administrative Data
The Data Trust’s integrated administrative data system uses data that are collected for an organization’s operational purposes such as managing program enrollment or tracking services provided. Integrating administrative data addresses the central challenge of organizational and information silos, particularly across the often fragmented health and human services landscape. Community challenges and opportunities span organizations and sectors, but the data that would help us better understand issues and create solutions are located in individual agencies. Integrated administrative data systems allow us to more comprehensively understand how people move within and across organizations and sectors. Importantly, the Data Trust practices strong data ethics and vet all uses of data through our participatory governance processes.
The focus of the Data Trust’s integrated administrative data system is on people. Because the Data Trust’s administrative data is about people and, because the information that organizations collect on people’s lives can be sensitive and private, there is an additional layer of legal responsibility. As such, ongoing governance processes accompany our work. We manage the deposit, use and privacy of these data with a suite of legal agreements and a decision-making process that all partners agree to before joining the Data Trust (visit the Data Trust website for a description of how the Data Trust works).
This year’s report includes data from one more partner: Lakeview Neighborhood Alliance. See Appendix B for more information. The data from these partners is reflected in all analyses, including longitudinal analyses, and therefore historical counts in this report may differ from previous reports.
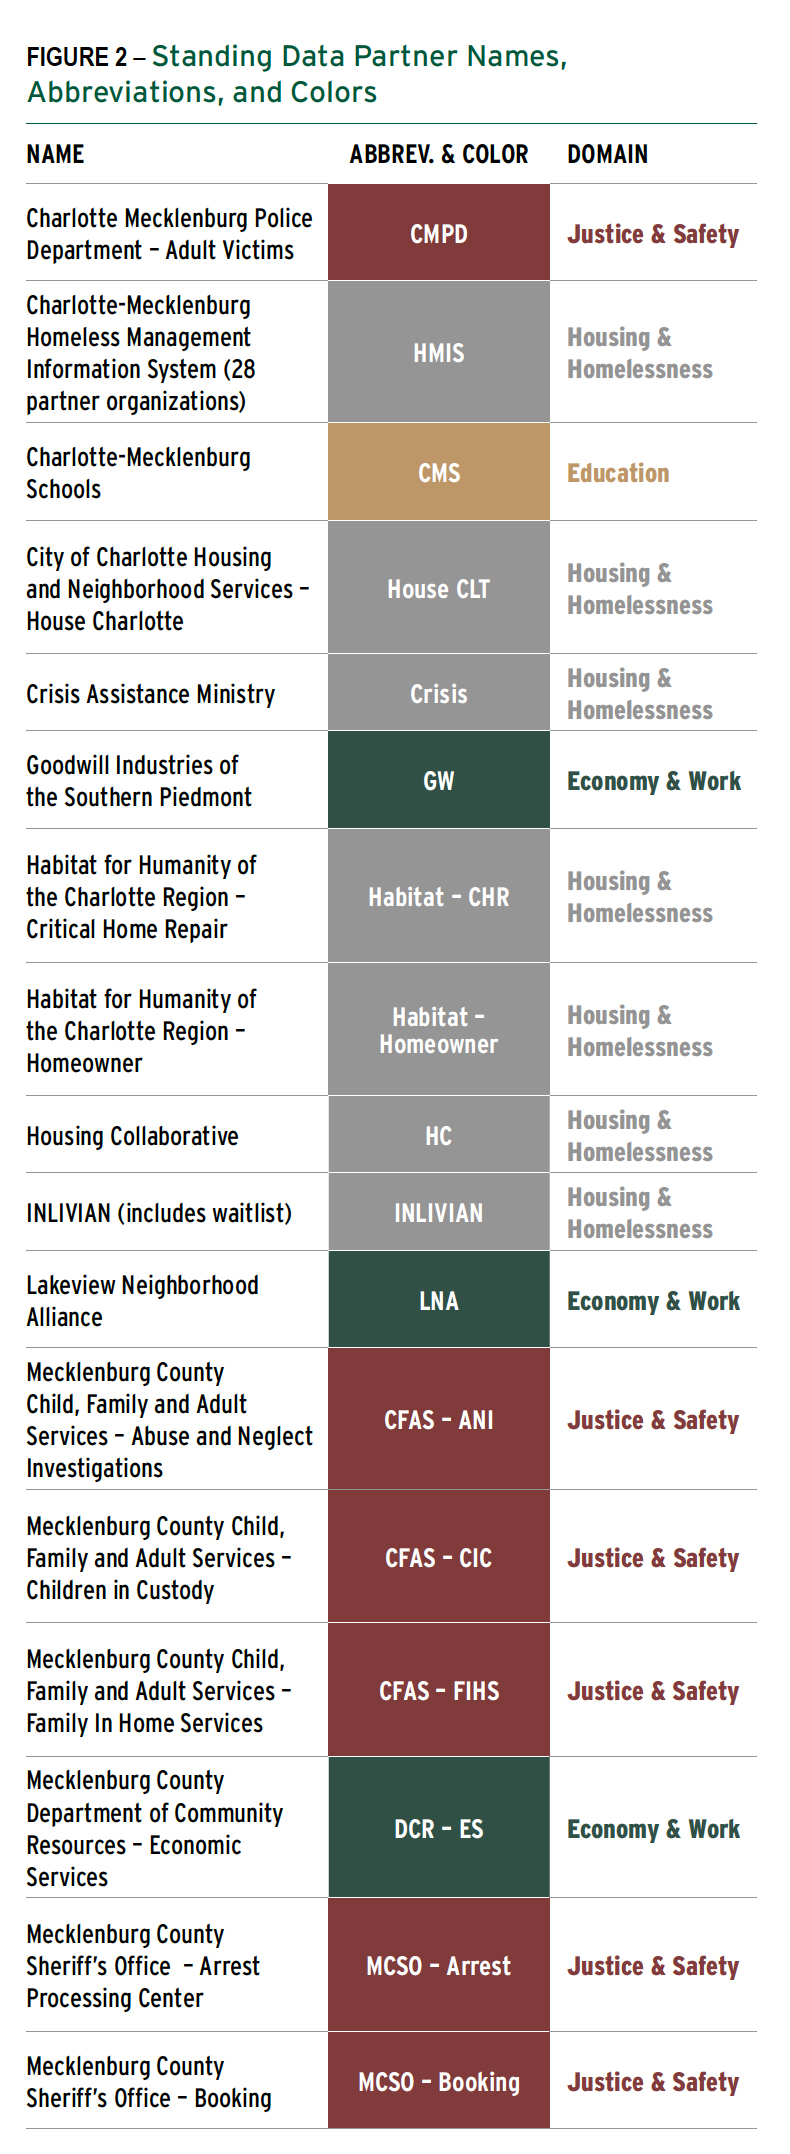
The administrative data described below includes the data holdings of our standing partners, both individual and collaborative partnerships.5 We use abbreviations and colors to refer to data partners in the graphics in the report. The colors are associated with the quality of life domain that each data partner represents. For example, all data partners who represent the Housing and Homelessness domain will be the same color (see Figure 2).
Below, we describe the count of unduplicated individuals in our data holdings, the extent to which individuals are present in the data of multiple partner organizations, and individual’s demographic characteristics. We describe an annual count of our reporting year: 2025. We also provided longitudinal information since 2016.6
See Appendix A for a more in-depth description about partner years and methods included in analyses and all data tables.
How Many Unique People are Reflected in Our Administrative Data?
In 2025, administrative data on 397,572 unduplicated individuals were included in the Data Trust, approximately 33% of the Mecklenburg County population (American Community Survey 1-Year Estimates, 2024). Compared with last year’s report, there are four percent fewer unique individuals represented (n=-16,902; total unique people in 2024 was 414,474). This report does not include 2025 data from Mecklenburg County Sheriff’s Office, which may account for some of the decrease.
Since 2016, over 1.1 million (1,161,819) unique individuals administrative data have been reflected in the Data Trust, while overall annual unduplicated counts of individuals remain fairly steady, ranging between 381,398 in 2020 to 422,744 in 2022, or 34.8% to 37.9% of the annual Mecklenburg County population. Figure 3 below describes the annual unduplicated count of individual data in the Data Trust compared to the annual Mecklenburg County population.
Figure 4 displays the total number of unique individuals by data partner. Unless otherwise noted, the numbers are for the entire calendar year of the year displayed. Use the slider bar to see different years. Data partners vary widely by how many people they serve and the size of their datasets. In 2025, the largest datasets were Mecklenburg County Department of Community Resources - Economic Services, Charlotte-Mecklenburg Schools, Crisis Assistance Ministry and Charlotte-Mecklenburg Police Department.

Figure 4. DSS - ES, CMS, Crisis, and CMPD represent the largest data partners (n= 409,725). Note: MCSO - Booking represents 2024 and MCSO - Arrest represents 2022.
Seven data partners had fewer unique people compared with last year’s report (calendar year 2024). The largest changes were from Homeless Management Information System (-31% change; n=4,658) and Mecklenburg County Child, Family and Adult Services - Family in Home Service (-16.9% change; n= 195):
- Charlotte-Mecklenburg Schools (-4.6% change; n=8,236)
- Charlotte-Mecklenburg Police Department (-5.4% change; n=2,573)
- Homeless Management Information System (-31.1% change; n=4,658)
- Goodwill Industries of the Southern Piedmont (-13.6% change; n=631)
- Housing Collaborative (-11% change; n=165)
- Mecklenburg County Child, Family and Adult Services - Family in Home Services -16.9% change; n= 195)
- Habitat for Humanity of the Charlotte Region - Homeowner (-12.6% change; n=24)
Seven data partners increased the number of unique people compared with last year’s report (calendar year 2024).7 The largest changes were from Habitat for Humanity of the Charlotte Region - Critical Home Repair (+59.2% change; n=80) and INLIVIAN (+24.2% change; n=992):
- Mecklenburg County Department of Community Resources - Economic Services (0.77% change; n=1,625)
- Crisis Assistance Ministry (0.55% change; n=264)
- Mecklenburg County Child, Family and Adult Services - Abuse and Neglect Investigations (4.3% change, n=493)
- INLIVIAN (24.2% change; n=992)
- Habitat for Humanity - Critical Home Repair (59.3% change; n=80)
- Mecklenburg County Child, Family and Adult Services - Children in Custody (15.7% change; n=28)
- City of Charlotte Housing and Neighborhood Services - House Charlotte (5.2% change; n=<10)
See Appendix A for more information.
What are the Characteristics of the People in the Data Trust’s Administrative Data?
The administrative data held by the Data Trust includes information our partners collect about the characteristics of the people they serve. Whether specific data are collected, however, isn’t always consistent. These variations are typical in administrative data and can be driven by government regulations, funding requirements and/or simply the evolution of an organization’s data system. Figure 5 below describes the types of characteristics that are collected by each of the Data Trust’s standing data partners in their most recent deposit.
Figure 5 . There is variation in the characteristics collected by data partners.
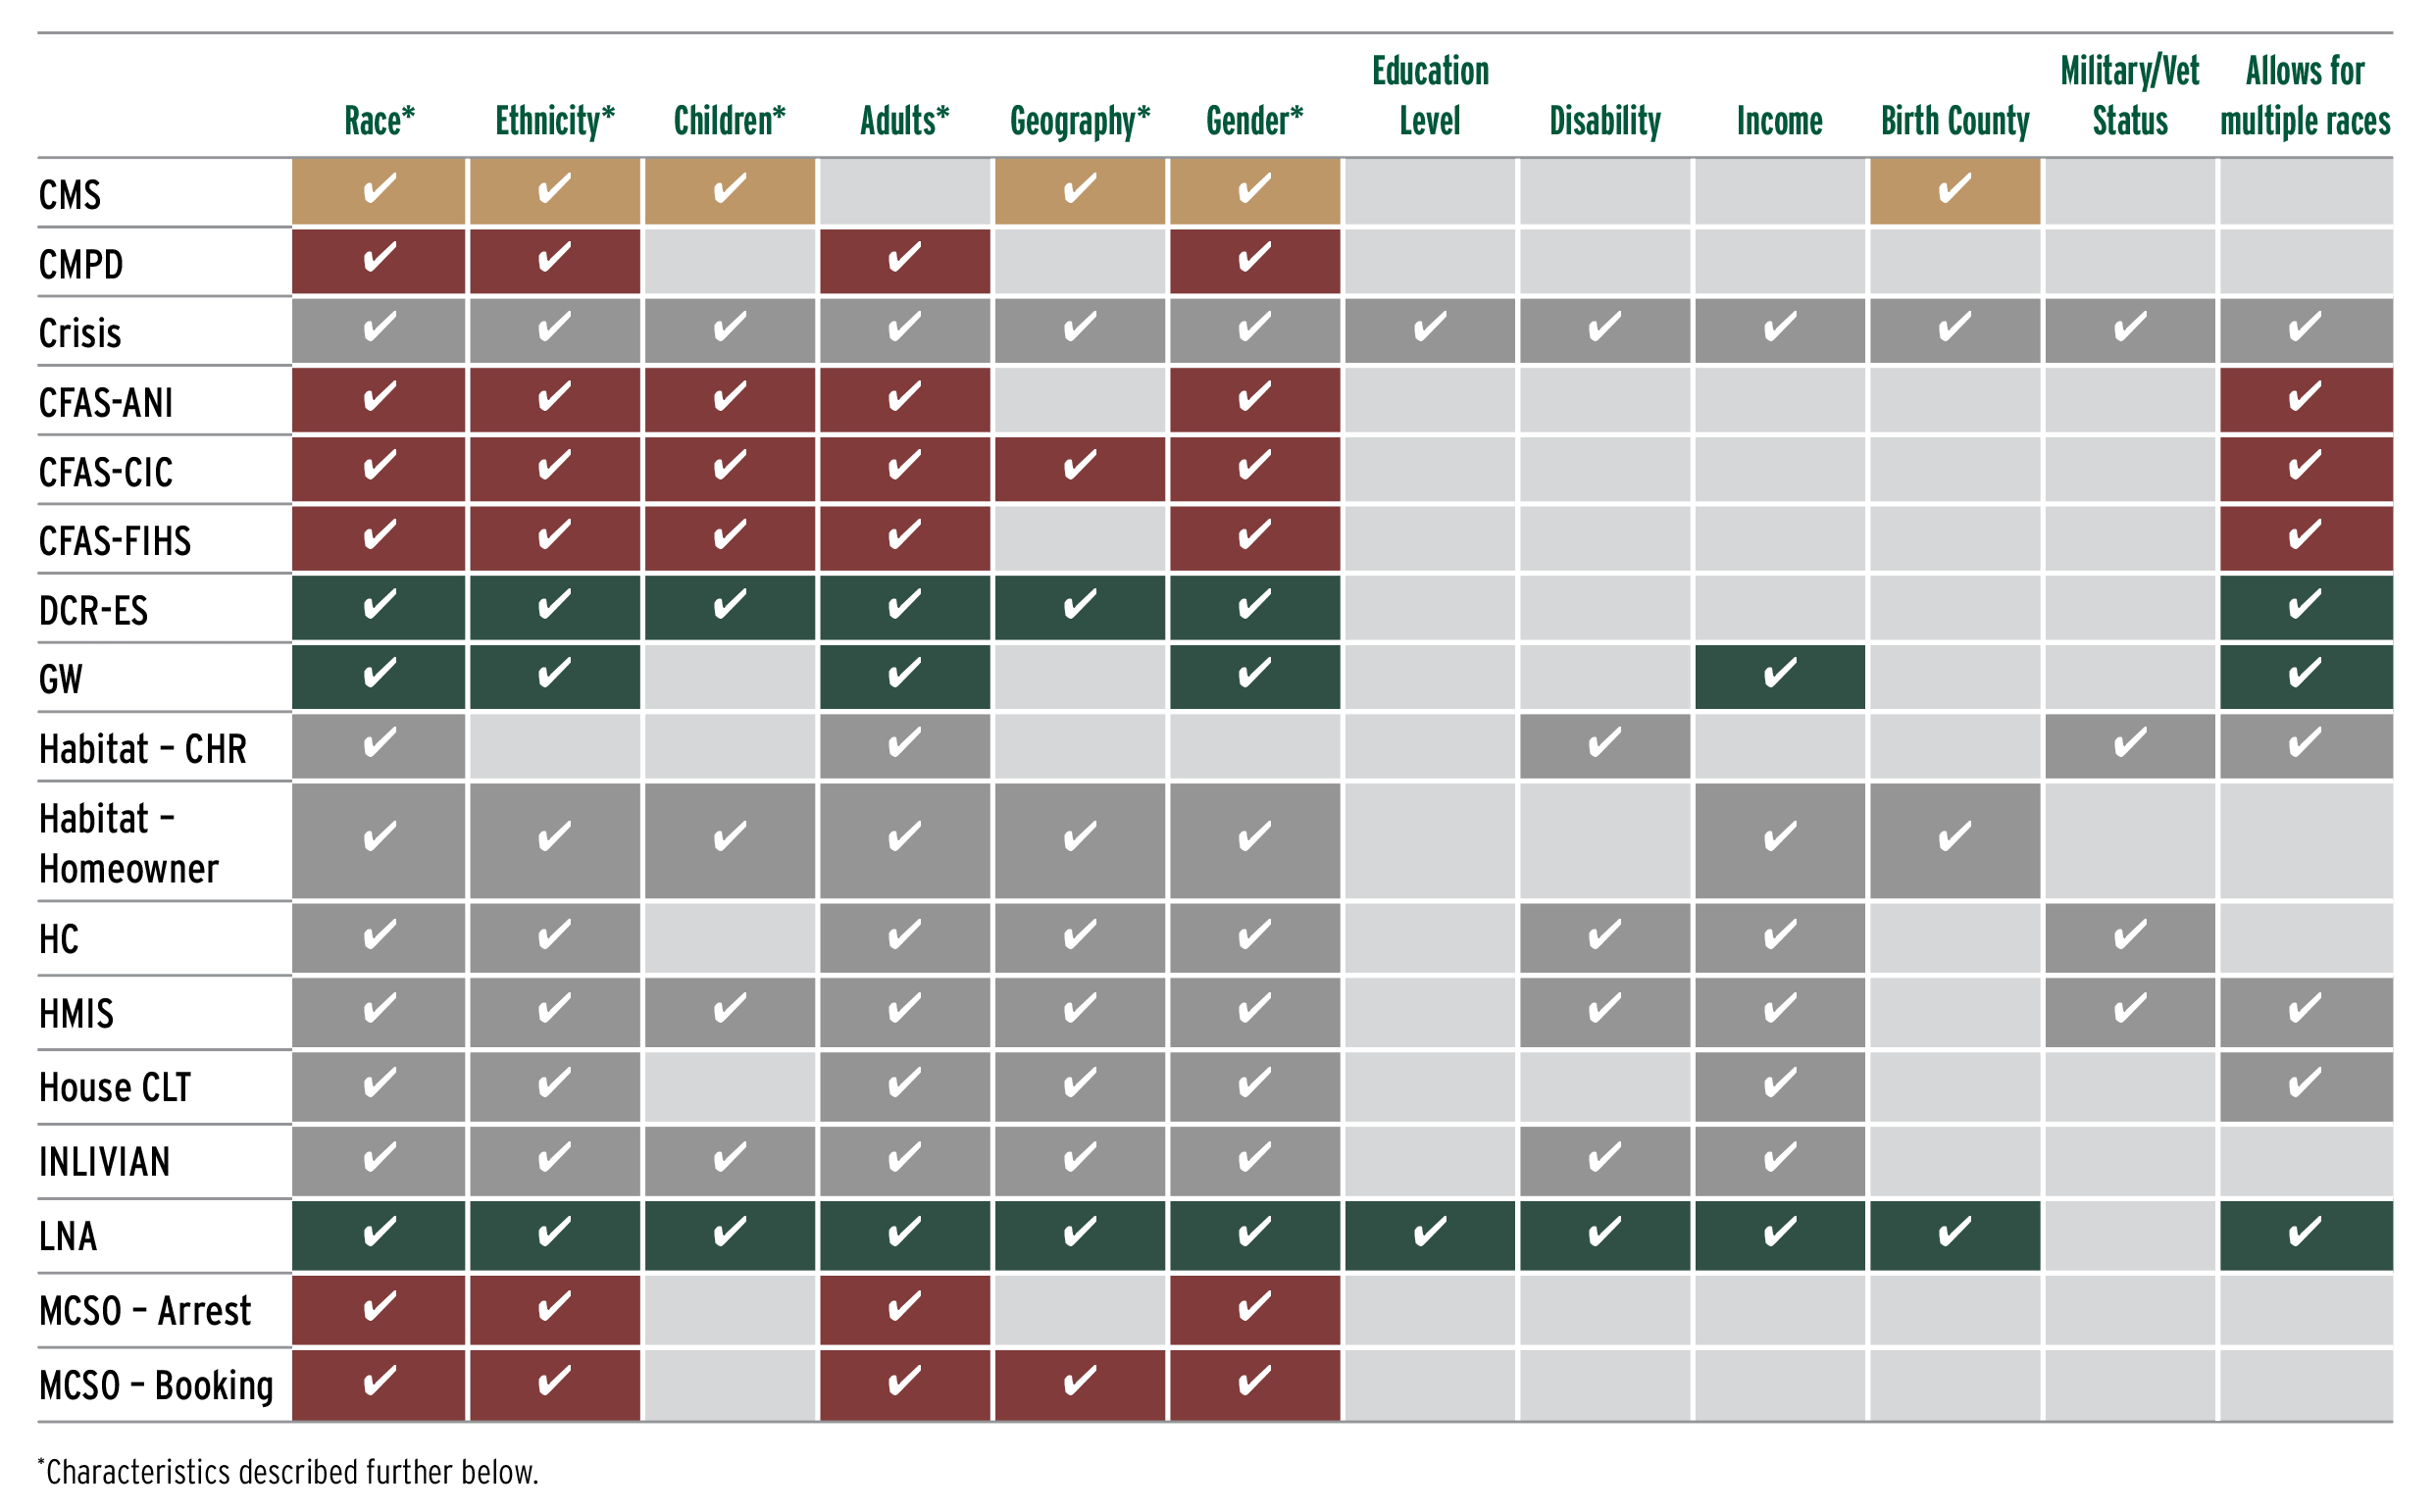
As the figure above shows, there is variation in what data partners collect. This section focuses on variables that are collected the most consistently across data partners: race, ethnicity, gender, age and geography. We also include a map related to median income. In future reports, more detailed income data may be included.
Normalization: The data collected about people’s characteristics may vary from partner to partner. The Data Trust normalizes these data, meaning we make methodological decisions to standardize the data so they can be grouped and compared. Namely, we normalize the names of the racial, ethnic and gender groups because there is variation across data partners. The Data Trust acknowledges the need to standardize data as well as the risk of doing so, particularly when it can obscure and oversimplify identities. More information about normalization is available in Appendix A.
Race and Ethnicity
In 2025, the majority of individuals (46.6%, n=185,388) whose administrative data are in the Data Trust identified as Black or African American (see Figure 6). That is the same as the share of individuals who identified as Black or African American in last year’s report (46.5%, n=191,496). White individuals were the second largest group in the Data Trust, representing 21.8% of individuals (n= 86,657), roughly 1.6% less than last year (23.4%, n=96,518).
The share of individuals who identified as multiracial increased by 1.5% compared with last year. Those who identified as multiracial represented 15.9% (n=63,078) of individuals in the Data Trust in 2025 (14.4%, n=59,329 in 2024). All other racial and ethnic identities remained roughly the same as last year.
Individuals who identified as Hispanic or Latino made up 9.5% (n=37,670) of people in 2025 (9%, n=36,983 in 2024). Those identifying as Asian were 4.4% (n=17,304) of the people in the data (4.4%, n=18,071 in 2024). Individuals who identify as American Indian or Alaska Native or Native Hawaiian or Pacific Islander each made up less than one percent of the Data Trust’s administrative data (0.2%, n=607; 0.1, n=281, respectively), remaining the same as last year (0.2%, n=734; 0.1%, n=320, respectively in 2024).
Since 2016, the proportions of racial and ethnic groups represented in Data Trust data have been relatively similar. There has been a slight increase over time in the percentage of Hispanic or Latino people and/or multiracial people, and where race/ethnicity is unknown, as well as a slight decrease in White people, similar to larger population trends in Mecklenburg County over the same period (Figure 7).
Representation: In several places, this report describes proportionate representation and disproportionate overrepresentation or underrepresentation. This refers to how the data we hold compares to data on the overall population of the County or the particular area we are describing. Understanding representation is important in the use and interpretation of Data Trust data.
Compared to the Mecklenburg County population, people who identify as Black or African American are overrepresented in Data Trust data (see Figure 8). People who identify as Black or African American make up 29% of Mecklenburg County, overall, compared with 46.6% of people in the Data Trust. People who identify as multiracial are also overrepresented in the Data Trust, compared with Mecklenburg County; there are more than three times more individuals who identify as multiracial in the Data Trust than the County overall. This may be due to the fact that, in the Data Trust data, we included a count for all racial categories a person identified within any dataset. We may be capturing more detail than the U.S. Census is able to report.
White individuals are underrepresented in Data Trust data in comparison to the Mecklenburg County population; the share of people who identify as White in the Data Trust is half of the share of people who identify as white in Mecklenburg County, overall. People who identify as Asian, and Hispanic or Latino individuals are also underrepresented in the Data Trust. There is a slightly higher percentage of people who identify as American Indian or Alaska Native and Native Hawaiian or Pacific Islander than the Mecklenburg County population.
Among people who are in more than one dataset in 2025 (n=88,733), the over- and underrepresentation is even more pronounced (see Figure 9).
For the groups that are overrepresented:
- People who identify as Black or African American, and who are in more than one dataset, make up 59.7% (n=53,014) of people who are in more than one dataset, compared to 46.6% (n=185,388) people who identify as Black or African American overall in the Data Trust. This is slightly lower than last year’s report (two or more datasets 61.2%, overall 46.5%).
- The percentage of people who identify as multiracial, and are in more than one dataset, is double the percentage of the overall population of people in the Data Trust (31%; n=27,499 and 15.9%; n=63,078, respectively). The share of people who identified as multiracial and were in two or more datasets increased 1.5%, compared to last year’s report (28.5%).
For the groups that are underrepresented:
- The share of people who identified as White and were in two or more datasets (5.7%; n=5,090) is four times smaller than the people who identify as White in the Data Trust, overall (21.8%; n=86,657). The share of people who identified as White and were in two or more datasets decreased by about 1.2%, compared to last year’s report (6.9%).
- People who identify as Asian and who were in two or more datasets (1.8%; n=1,598) are about half the share of people who identify as Asian in the Data Trust, overall (4.4%; n=17,304).
- Hispanic and Latino people who were in two or more datasets (1.7%; n=1,479) are roughly five times fewer than Hispanic and Latino people in the Data Trust, overall (9.5%; n=37,670).
All other racial and ethnic identities of people who are in more than one dataset represent similar percentages compared with the overall population of the Data Trust.
NoteUnderstanding Data Overrepresentation and Underrepresentation
There are a number of possible reasons for overrepresentation and underrepresentation in Data Trust data. One reason may be the implications of eligibility criteria. Many of the datasets at the Data Trust are associated with economic and other eligibility criteria. For example, people who apply for Mecklenburg County Department of Community Resources - Economic Services (our largest dataset) are seeking financial support. Undocumented individuals, however, are not eligible for many government programs and this may deter mixed-status households (households that include both documented and undocumented immigrants) from enrolling in services (e.g., Bovell-Ammon et al., 2019; Vargas & Pirog, 2016). This could lead to underrepresentation of Hispanic or Latino people in the Data Trust data despite their size and growth in the broader Mecklenburg County population. For context, 11.7% of the Mecklenburg County population are not U.S. citizens, though they may have other legal status (U.S. Census American Community Survey 1-Year Estimates, 2024, Table B05001). Additionally, 34% of people who identify as Hispanic or Latino in Mecklenburg County are under 18 years old, which may also influence their underrepresentation in datasets that only include adults (U.S. Census American Community Survey 1-Year Estimates, 2024, Table B01001I).
While eligibility criteria may account for the above underrepresentation, explanations for disproportionate representation in administrative data may be less straightforward. For example, historic policies and practices like redlining and subsidized housing support explicitly restricted equal access to housing and homeownership, and has been linked to a negative impact on wealth generation for families of color (e.g., Scott, 2024). These early and subsequent policies have contributed to the wealth gap between Black and White households impacting who has sufficient household or network wealth to prevent or delay use of public safety net programs. This can partly explain why people who identify as Black or African American, who have less access to wealth that can prevent safety net use, are overrepresented in the Data Trust data.
It is also important to consider who is more likely to be monitored in our society and for what reasons. Even in an age of digital surveillance through our phones and wearables, we are more likely to collect sensitive data during people’s most difficult times, and disproportionately so, from families of color and families who are poor (e.g., Eubanks, 2018; Fong, 2020). Understanding the extent and implications of disproportionate representation in our data can help us make ethical decisions about data use and guard against research that furthers harm.
One benefit of an integrated administrative data system is that it allows us to combine racial identities across datasets. For instance, where one partner used a multiracial category and another allowed a person to list all their racial or ethnic identities (see Figure 5 for a list of how race and ethnicity data are collected across data partners), we begin to see the complexity reflected in a seemingly simple category.
Here, we describe the racial or ethnic category for each person whose administrative data is in the Data Trust. The charts combine all racial and ethnic identities for every unique person, across all datasets from 2016-2025. The visualizations describe how major racial and ethnic categories are linked to an array of diverse racial and ethnic identities. Figure 10, called a chord diagram, shows the racial and ethnic identities for all unique people represented in the Data Trust, and the makeup of multiracial and ethnic identities.
How to read the chord diagram: Each segment of the chart displays a racial or ethnic category. The size of each segment shows how large that racial or ethnic group is based on how many unique people identify with that category. The different colored lines in each segment link to the additional categories people identified. Thicker lines represent more people. For example, under the Hispanic or Latino segment, about half of the people who identified as Hispanic or Latino also identified as White. And under the Black segment, a small group also identified as Hispanic or Latino.
Black or African American is the largest group in the Data Trust’s integrated data, followed by white, multiracial, Hispanic or Latino and then Asian. The charts below demonstrate, however, that these categories are not mutually exclusive and that nuance is not necessarily captured in our typical categories of race and ethnicity. People who identify with smaller groups like American Indian or Alaska Native and Native Hawaiian or Pacific Islander are much more likely to identify with more than one race, while people who identify as Black or African American or white are more likely to identify with a single race.
The Sankey diagram below (Figure 11) provides a more detailed picture of each racial or and ethnic identity and the extent to which other identities are part of each category in Data Trust data in 2025.
How to read the Sankey diagrams: Each chart displays a racial or ethnic category. Use the box at the top to select which racial or ethnic group you want to look at. The left side of the chart is the main racial or ethnic category, and the right side shows which other races are linked to that main racial or ethnic category. Thicker lines indicate more people.

The integration of administrative data allows us to see a more nuanced description of race and ethnicity among our partners. Both the Chord and Sankey diagrams remind us of the complexity of the categories we often default to and particularly challenge our framing of issues around single racial groups like Black or White. The data also suggest care around the use of catch-all categories like “multiracial,” since people who identify with smaller racial groups like American Indian or Alaska Native and Native Hawaiian or Pacific Islander are more likely to identify with more than one race. More information on methods regarding the above chord and Sankey diagrams is available in Appendix A.
Gender
In 2025 people who identified as female (52.3%, n=207,764) made up a slightly larger share of people represented in the Data Trust than those who identified as male (46.2%, n=183,576; see Figure 12). A small number of people represented in the Data Trust (1.56%, n=6,232) identified as a gender other than singularly male or female, with more than one gender, or had an unknown gender. This is similar to last year’s report. The gender distribution is representative of the population in Mecklenburg County where females represent 51.7 % of the population and males make up 48.3 % (ACS 1-Year Demographic and Housing Estimates, 2024. Table DP05). The U.S. Census does not collect gender data other than male or female.
Age
In the Data Trust data, people are represented across different phases of the life course - from infancy to old age. Historically, the Data Trust focused primarily on children and families, but subsequent data partnerships extended to adults. For some data partners, like Mecklenburg County Child, Family and Adult Services - Abuse and Neglect Investigations and Charlotte-Mecklenburg Schools, only children are represented; while some data partners, like Goodwill Industries of the Southern Piedmont, Mecklenburg County Sheriff’s Office and Charlotte-Mecklenburg Police Department only collect or share information about adults. Other data partners, like the Homeless Management Information System, Crisis Assistance Ministry, Lakeview Neighborhood Alliance and INLIVIAN collect information about entire households, so both children and adults are represented.
Figure 13 displays the median age and age ranges of the people represented in each data partner in 2025. Outliers (negative ages and ages over a certain threshold) are filtered out. Age was calculated as of the most recent entry in 2025 for all partners except Mecklenburg County Sheriff’s Office - Arrest and Booking due to data availability. Most data partners have a population where the median age is under 40 years old. The people represented in Housing Collaborative, Habitat for Humanity of the Charlotte Region - Critical Home Repair and Lakeview Neighborhood Alliance are slightly older and have a median age over 40 years.
Where Do People in the Data Trust Data Live?
Address information in some partner datasets allow us to understand where people who are included in Data Trust data live across Mecklenburg County. Of the 397,572 unique individuals in Data Trust data in 2025, 90.8% (n=361,078) had one or more available addresses.
The map below (Figure 14) describes the neighborhood profile areas, also known as NPAs (these match with the Charlotte-Mecklenburg Quality of Life Explorer), that correspond with the address of those in datasets where addresses are available: Charlotte-Mecklenburg Schools (CMS), Charlotte-Mecklenburg Police Department - Adult Victims (CMPD), Mecklenburg County Department of Community Resources - Economic Services (DCR-ES), Crisis Assistance Ministry (Crisis), Habitat for Humanity of the Charlotte Region- Homeowner (Habitat - Homeowner), Habitat for Humanity of the Charlotte Region - Critical Home Repair (Habitat - CHR), City of Charlotte Housing and Neighborhood Services - House CLT (House CLT), Housing Collaborative (HC), INLIVIAN and Lakeview Neighborhood Alliance (LNA). The blue colors represent neighborhoods where there are higher numbers of people represented in the Data Trust. The green colors have fewer people.
As the map portrays, individuals whose data are in the Data Trust are present in nearly all of our NPAs. But as the shading suggests, there are areas with a greater concentration of people from Data Trust data. The five NPAs with the highest number of people represented in the Data Trust are:
- NPA 370 - This area holds the Grier Heights neighborhood, Habitat for Humanity of the Charlotte Region’s administrative offices, and the Mecklenburg County Health Department
- NPA 476 - This area is Uptown Charlotte. This area also has the Roof Above day shelter, Crisis Assistance Ministry administrative offices, and other shelters and resources for people experiencing homelessness and housing instability.
- NPA 371 - This area holds part of the Hidden Valley neighborhood along the Sugar Creek/I-85 corridor.
- NPA 53 - This area holds the Colony Acres neighborhood along Nation’s Ford Road and I-77.
- NPA 234 - This area holds the Autumnwood neighborhood and is between Hidden Valley and UNC Charlotte.
Using the Quality of Life Explorer to compare these areas with Mecklenburg County as a whole, areas with the highest number of people represented in the Data Trust have slightly higher percentages of people who identify as Black or African American and/or Hispanic or Latino; equal employment rates; lower medium household incomes; higher rates of enrollment in Food and Nutrition Services; fairly similar rates of high school graduates; lower rates of voter participation; lower tree canopy; higher proximity to low cost health care, public outdoor recreation and public transportation; lower rates of homeownership, smaller sized homes, older homes, and relatively similar average home sales prices and rental costs; and higher rates of transit ridership.
How are people in the Data Trust represented across neighborhoods?
The maps below help us better understand those areas of concentration. Each map describes a partner dataset compared to the overall share of the County population in each of the neighborhoods (NPAs). For example, if an NPA has five percent of the County’s population and also has five percent of the total people in one of the datasets, we estimate that they are proportionally represented. But if a neighborhood has one percent of the County’s population but five percent of the total people in one of the datasets, we estimate that they are disproportionately overrepresented. And if a neighborhood has five percent of the population but one percent of the dataset, we estimate that they are disproportionately underrepresented. Red indicates underrepresentation, purple indicates proportional representation, and green indicates overrepresentation. Additional information on our estimation method is available in Appendix A.
Explore the maps below for each data partner by selecting the dataset (Figure 15). Only data partners that provide addresses are included. For example, the map of the Charlotte-Mecklenburg Schools dataset has patterns of proportionate and overrepresentation spread fairly broadly across the county, with underrepresentation in the southern and very northern parts of the county. Enrollment in charter schools, private schools and homeschooled students may explain the disproportionate representation.

What Do We Know About the Income Levels of the People Represented in the Data Trust?
Building on the representation maps above, we examined how the representation of Mecklenburg County residents in the Data Trust varies across neighborhoods with different income levels. We used NPA-level median household income estimates from the Quality of Life Explorer for 2023, the latest year available in our database.
The maps below classify NPAs into three groups based on median household income: the lowest income third ($66,927 and below), shown in red; the middle income third ($66,928–$101,964), shown in purple; and the highest income third ($101,965 and above), shown in green. Hatching (blue lines) identifies NPAs within the selected representation category from the analysis above. Users can select specific datasets using the dropdown box, as well as one representation category (over-represented, roughly proportional, and under-represented) at a time to explore its distribution across income groups within that dataset. Changing the dataset will only affect the representation category layer. For context, Mecklenburg County’s median household income was $83.765 according to the U.S. Census Bureau’s 2023 American Community Survey 5-Year Estimates.
Differences in representation across neighborhood income groups highlight the potential for selection bias in analyses using Data Trust partner data and the need for methods that account for uneven representation across the socioeconomic spectrum. These comparisons describe neighborhood income levels rather than the incomes of individual people represented in the Data Trust. See Appendix A for additional methodological details.
An example of how this map can be used to explore relationships between representation and income distribution is shown in the Mecklenburg County Department of Community Resources - Economic Services (DCR–ES) dataset. Overrepresentation is concentrated in Charlotte’s crescent of neighborhoods west, north, and east of Uptown, overlapping many NPAs in the lowest and middle income thirds. Comparatively few NPAs in the predominantly higher-income southern wedge and northern Mecklenburg County are overrepresented. Although some higher-income NPAs also show overrepresentation, the map suggests that people represented in DCR–ES are disproportionately drawn from communities within the crescent relative to those communities’ shares of the county population.
In future reports, we hope to incorporate income information collected directly by data partners. Although most partners collect some form of income data, differences in definitions and collection practices limit comparability. Incorporating these measures will require collaboration with partners to develop consistent definitions and standardize the data.

What and Who is Missing in the Data Trust Data?
The characteristics of the data described above demonstrate the complexity of the data and the people represented in the Data Trust. And yet, significant information is still missing from the available data. Having a better sense of who and what is missing in our data can guide future data partnerships and research focus.
For demographic data to be included in this report, at least 60% of data partners must collect data about that group. This year, disability status/type, veteran status and country of origin are not included because comparatively few partners collect the information and it does not meet the 60% threshold. Income is collected by at least 60% of data partners, however there is vast variation in how income is collected. We are exploring ways to standardize income variables to use in future reports. Decisions about standardizing these categories will be informed by our data partners and may be included in future reports.
In addition to the characteristics we didn’t include in this report, the available data on the characteristics we did include may not be sufficiently comprehensive. For example, we should assume that we are underestimating the number of people who identify with a gender other than singularly male or female, since there is limited information collected. In addition, the available data is limited to a single ethnicity, Hispanic or Latino. And similarly, we do not have enough information about the country of origin of people in the data. We know the Charlotte region has a rich and diverse immigrant population, and country-of-origin data would help us better understand these groups. Charlotte-Mecklenburg Schools began sharing country of origin data in 2026, which we will explore for next year’s report.
Since many of our data partners are serving people who are in some form of economic crisis or a crisis that’s closely associated with lower-income households (homelessness for instance), the Data Trust is missing data on people with higher incomes, who are likely not to experience some of the same hardships. Without this data, it’s difficult to understand the pathways and factors that influence economic mobility. At the same time, the Data Trust also has data that represents positive aspects, such as homeownership. Among our partners who regularly deposit data, Charlotte-Mecklenburg Schools is one of the few that serve a range of income levels. In order to better understand a comprehensive economic picture, including additional partners whose data include individuals across income levels will be important.
Additionally, the data may omit people who do not meet eligibility requirements for programs and services. This includes people who are not eligible for programs based on immigration status or because their income is just above the eligibility threshold. The Data Trust data may, therefore, not capture those in our community who still struggle, but don’t qualify for or interact with services, including those who could most benefit from interventions that may prevent a person from further hardships.
Since many of our data partners represent a fairly young population, we are missing comprehensive information about older adults in our community. Mecklenburg County Child, Family and Adult Services has shared five datasets related to services for older adults and adults with disabilities, which will be included in next year’s report (see Appendix B for more information).
Finally, we are missing important data partners that could help us better understand who is thriving, who is left behind and why. While many areas such as homelessness and education are well represented in our current data, gaps remain in these and other domains. Arts and culture program data, health data, early childhood data, workforce data, and data from our broader metropolitan region would strengthen this community resource, and engage more partners and researchers in its use and application. This annual report can serve as an ongoing assessment of who and what is missing in our data and the success of strategic efforts to create a more comprehensive and representative resource.
How are People Reflected Across Partners?
A key benefit of the Data Trust’s administrative data system is the ability to understand the extent to which people served by one partner are also served by other partners. Operationally, it helps organizations understand if there are gaps in their services, if they are duplicating services or effectively layering services with another provider, or if their programs are reaching their target audience who may be best represented in another partner’s data. From both an operations and research perspective, it is helpful to understand if involvement in one organization may impact outcomes in another. For example, if a student is in the child welfare system, how might that involvement impact school attendance or performance? Or if a person who is experiencing homelessness secures stable housing, are they less likely to be arrested or use the emergency room?
Overlap Across Partners
In 2025, the majority of individuals whose administrative data were in the Data Trust’s integrated data system were reflected in one partner’s data (see Figure 17; 77.7%, n=308,839) and 17.8% (n=70,810) were reflected in two partners’ data. This is very similar to the overlap reflected in last year’s report. Comparatively few individuals were reflected in three or more partners’ data with only 3.8% (n=15,245) reflected in three, and 0.7% (n=2,678) reflected in four or more partner datasets. 8 This is a slight decrease compared with last year’s report.
Cumulatively, since 2016, 66.3% (n=770,058) of individuals whose administrative data is in the Data Trust were in one partner’s data and 18.4% (n=213,643) were reflected in two data partners’ data (see Figure 18). Importantly, the 15% of people who were in three or more partners’ data number nearly 180,000 people (15.4%, n=178,118). A little more than 6% (6.5%, n=75,205) were reflected in four or more partners’ data. These numbers are very similar to last year’s report.
Both annually and cumulatively since 2016, the majority of individuals in the data were only in one partner’s data, with a small minority reflected in three or more partners. This distribution represents a rich area for further research and understanding. For example, what factors are associated with individuals’ involvement with multiple organizations or with only one? Are there shared characteristics or experiences of people who interact with three or more partners?
Notably, over time, we expect to see greater overlap between partners than we would see annually because individuals may be reflected in multiple services as they age. For example, a child or adolescent receiving child welfare services may be reflected as an adult in Goodwill Industries of the Southern Piedmont or Charlotte-Mecklenburg Homeless Management Information System. These longitudinal patterns are also important patterns for further research. What factors in childhood predict whether the individual is more or less likely to become homeless as an adult? Administrative data along with Explorer data can be used to examine these and related questions about quality of life.
Overlap Across Datasets
Since the Data Trust is here to link data, it is also helpful to understand the extent to which each dataset overlaps with other datasets. Figure 19 visualizes the overlap across all datasets from calendar year 2025 or most recent calendar year available and includes all individuals, even if they did not overlap with another partner in 2025 (n=411,814).9 Data partners are color coded to associate with the domain they represent. See Figure 2 for a reminder of the data partner abbreviations, domains and colors.
The colored bands within each data partner reflect the domains the people in each data partner are connected with. For example, under the Charlotte-Mecklenburg Police Department (red; safety and justice domain), there is a large share of people who have no overlap with other data partners (light grey), a portion that overlap with Mecklenburg County Department of Community Resources - Economic Services (green; Economy and Work domain), and a small share who overlap with data partners in the Housing and Homelessness domain (dark grey). Thicker lines represent more people. The figure demonstrates the variety of ways that people are linked across datasets, and visualizes how people and data partners overlap with different quality of life domains. This presents opportunities to understand the nature of the overlaps and more comprehensively develop and consider solutions that span organizations and domains.

The figures below describe, by partner, the extent to which the individuals in each partner dataset were reflected in that of other partners (Figure 20). The figures, called tree maps, visualize the percentage of individuals in one dataset that overlap with the others. Data partners are color coded associated with the domain they represent. See Figure 2 for a reminder of the data partner abbreviations, domains and colors. The dropdown box under “Source Dataset” allows you to select a dataset and explore how people in the source dataset are linked with other datasets. For example, if you select HMIS as the source dataset, you can see how people in the Homeless Management Information System dataset overlapped with other partner datasets. You can use the bar to explore overlap across years. The tree maps do not display data partners where there are fewer than 10 people who overlap or if the overlap is so small that it does not appear on the tree map.

Figure 20. Dataset overlap
The way in which the Data Trust links data together allows us to see how the systems and services in our community are linked by the people they serve. Every data partner serves people who are also served by other partners. Further analysis to understand these connections allows us not only to see connections across systems, but better understand, coordinate and improve service delivery.
For example, we can better understand connections across the housing continuum (in other words, how people are linked across the data partners in the homelessness and housing domain). When we look at INLIVIAN (which includes people both receiving housing subsidies and on the waitlist), a small share of the people engaged with another agency providing housing support sometime in 2025: nine percent of people interacted with Crisis Assistance Ministry; almost six percent (5.7%) used a service through the Homeless Management Information System, and one percent were served by the Housing Collaborative. By exploring these connections, we can uncover elements of successful long term housing and where gaps in support may still exist.
The absence of overlap can also be telling. For instance, more than a third (35.2%) of the people in the Crisis Assistance Ministry dataset, and almost two-thirds (60.0%) of the people in the Mecklenburg County Department of Community Resources - Economic Services did not overlap with any other data partners, which may provide opportunity to explore these gaps and connect people to additional resources if needed.
Sometimes, the absence of overlap reflects different populations reflected in data partners. For example, a little over half (50.2%) of the children and youth in the Mecklenburg County Child, Family and Adult Services-Abuse and Neglect Investigations dataset are linked with Charlotte-Mecklenburg Schools, but a large share of the children are not yet school aged so would not be reflected in school data. Additionally, data partners like Goodwill Industries of the Southern Piedmont and Charlotte-Mecklenburg Police Department Victim only represent adults, so they would be less likely to overlap with the datasets that involve only children. The various ways data overlap or fail to do so are rich opportunities for additional research.

DATA USE, RESEARCH AND IMPACT
The Institute and Data Trust maintains a community data infrastructure so that the data can be used for community benefit, specifically through research, evaluation and planning. As a resource to both the community and the University, we engage researchers who are based in our local government and nonprofits, as well as academic researchers doing community-engaged research and advancing knowledge in the nine domains we address. This section summarizes the use and impact of the Explorer tools, the ways in which Data Trust data were used, projects completed by Institute researchers during 2025 and the work of the Impact, Data, and Evaluation Academy.
Twenty-one projects were started, two were continued and eleven projects were completed for a total of 34 active projects in 2025, not including initiatives like the Carolinas Regional Explorer and the Regional Well-Being Survey that will be launched in 2026. The three most studied quality of life domains across all of the Institute’s work in 2025 were Housing and Homelessness, Safety and Justice, and Economy and Work (Figure 21). Some projects explored multiple domains.
In 2025, the Institute also initiated three University Impact projects. University Impact projects are short-term, high-impact projects that draw on UNC Charlotte’s multidisciplinary expertise to complete research related to quality of life across the region. These projects incorporate a range of faculty expertise, as well as the perspectives of community partners. Impact projects involve partnerships with leaders from the corporate, government and non-profit sectors. This year’s impact projects were:
- Housing Trust Fund Research Brief Series (funder: City of Charlotte)
- State of Child Care in Mecklenburg County (partially funded by and co-led with Childcare Resources, Inc.)
- Alliance Health Managed Care Organization Research Roadmap (funder: Alliance Health)
Additional details are available in Appendix C.
Use of Explorer Tools
As publicly available tools, the Institute’s Explorer tools (Quality of Life Explorer and Carolinas Regional Explorer, in development) are used by many different stakeholders for a variety of purposes. Below, we share some highlights of the use and impact of the Quality of Life Explorer in 2025.
In 2025, more than 16,800 unique people visited the Quality of Life Explorer. Additionally, this past year, the Institute hosted ten group presentations of the Quality of Life Explorer, half of which were to the UNC Charlotte campus community and half to the regional Charlotte community.
| Presentation Audience | Campus / Charlotte Region |
|---|---|
| Mecklenburg County Internal Consultants | Charlotte Region |
| UNC Charlotte Center for Community, Heritage and the Arts Event | Campus |
| Mecklenburg County Criminal Justice Services Youth Leadership Board | Charlotte Region |
| Charlotte Mecklenburg Library | Charlotte Region |
| CORE Faculty Engagement | Campus |
| Levine Scholars | Campus |
| Camino Research Institute | Charlotte Region |
| Public Health Graduate Students | Campus |
| Charlotte Urban Institute Open House | Campus |
| 2025 Schul Forum | Charlotte Region |
| Innovation Incubator - Central Ave./Albemarle corridor | Charlotte Region |
[Want to get on this list? Email us at urbaninstitute@charlotte.edu]
From Data to Impact - Quality of Life Explorer: One important way the Quality of Life Explorer is used is by the Institute’s Innovation Incubator Project, led by Toye Watson, director of community and strategic partnerships. The Quality of Life Explorer serves as a key resource that allows residents to engage with the data, alongside their personal experiences, to explore and better understand neighborhood context, identify priority areas and envision their desired future for the community. In 2025, the Incubator concluded its work in the Sugar Creek corridor and began work with the Central Avenue/Albemarle Road corridor.
Data License Requests
People interested in using linked data from the Data Trust must submit a Data License Request, or DLR. The Data and Research Oversight Committee, composed of data partner representatives and university subject matter and methodological experts, reviews and decides on DLRs. Note: DLRs may be submitted during one calendar year and approved in the next calendar year, and it may take several years for a project to be completed.
In 2025, a total of eight DLRs were submitted and approved. This is 33% (n=2) more than in 2024. Figure 22 shows the number of DLRs requested by year. The project names of these DLRs are below. Most (n=6) explored the Housing and Homelessness and/or Economy and Work domains. Three DLRs explore the Health, Mental Health, and Well-being domain. More information can be found in Appendix C.
- Quality of Life Explorer Update - Project Lead: Katie Zager, Charlotte Urban Institute/Data Trust (Domains: Economy and Work; Education)
- Evaluation of the Lakeview Guaranteed Basic Income Program - Project Lead:. Drew Reynolds Ph.D., Common Good Data LLC (Domains: Education; Economy and and Work; Safety and Justice; Housing and and Homelessness)
- Assessing the role of peer support specialists in housing stability using the homeless management information system: A retrospective matched cohort study - Project Lead: Lindsay Miller, Ph.D., UNC Charlotte Health and Human Services (Domains: Housing and and Homelessness)
- SECU - The Rise on Clanton - Project Leads: Eric Moore, Ph.D., and Jenny Hutchison, Ph.D., Charlotte Urban Institute/Data Trust (Domains: Housing and and Homelessness; Safety and and Justice; Health, Mental Health and and Well-being; Economy and and Work)
- State of Our Data 2025 - Project Leads: Sydney Idzikowski and Nick Occhipinti, Charlotte Urban Institute/Data Trust (Domains: All)
- Understanding how Charlotte Bilingual Preschool Prepares Dual Language Learners for Success in Elementary School - Project Lead: Drew Gadaire,Ph.D., UNC Charlotte Department of Psychological Sciences (Domains: Education)
- Project BOOST Retrospective Outcomes Analysis - Project Lead: Annelise Mennicke, Ph.D., UNC Charlotte School of Social Work (Domains: Safety and and Justice; Health, Mental Health and and Well-being; Housing and and Homelessness; Economy and and Work)
- The Role of Social Services in Reducing Housing Instability: A Local Analysis in Charlotte, North Carolina - Project Lead: Clysha Whitlow, doctoral student, UNC Charlotte Department of Psychological Services (Domains: Housing and andHomelessness; Economy and and Work)
The DLRs ranged between one and sixteen datasets. Four DLRs requested 4 or fewer datasets and four DLRs requested 7 or more datasets. Figure 23 shows how many times a dataset was requested. DCR - ES, CMS and HMIS Mecklenburg County Department of Community Resources - Economic Services, Charlotte-Mecklenburg Schools remain the most requested datasets. Homeless Management Information Systems was the third most requested dataset in 2025. Two DLRs linked a dataset that is external to the Data Trust. The majority of the DLRs in 2025 were from UNC Charlotte faculty or students, followed by the Charlotte Urban Institute. One DLR was requested by a nonprofit outside of the region, but working with a nonprofit in the region (see Figure 24). In addition, five DLRs continued from previous years.
Completed Data Trust Projects
Seven Data Trust projects were completed in 2025. Four of the projects were completed by Institute researchers on behalf of a community partner and one project was completed by Institute researchers as an internal project. One was completed by an outside entity and one was completed by a UNC Charlotte staff member. The “Domain” column identifies the quality of life domain(s) that align with the project. The PIs and Organization column shows the principal investigator, or PIs, and their organization. Principal Investigators are the lead of the project. As available, links to the reports are provided. Each completed project has potential for continued research in the topic area. See something you’re interested in? Contact the Data Trust to talk about a data request (DataTrust@charlotte.edu). See Appendix C for more information.
| Project Name | Description | Domain(s) | PI(s) and Organization |
|---|---|---|---|
| Student Emergency Fund - An Exploratory Analysis of Community Connections (January 2025) | The Vice Chancellor for UNC Charlotte’s Division of Student Affairs requested that Student Affairs Research and Assessment take a deeper look into our students who request Student Emergency Funds , or SEF. This project identified whether students who request SEF are receiving (or received in the past) selected community resources or have had interactions with selected agencies outside of the university. You can read findings here. | Education; Housing and Homelessness; Economy and Justice | Ellissa Brooks Nelson, Ph.D., UNC Charlotte Division of Student Affairs |
| Quality of Life Update (March 2025) | The Quality of Life team submits an annual DLR to update data on the Quality of Life Explorer. The Quality of Life Explorer can be accessed here. | All | Katie Zager, Charlotte Urban Institute and Data Trust |
| Examining Educational Outcomes for Children Involved in Foster Care (March 2025) | This project investigated educational outcomes of school-aged youth involved in the foster care system. The project used comparison groups of children in CMS experiencing homelessness and students who are neither homeless nor in foster care. | Education; Safety and Justice; Housing and Homelessness | Robert Pinka, Ph.D., Council for Children’s Rights |
| Transition age foster care youth and housing instability (June 2025) | This project examined the total prevalence of homelessness among foster-care youth and youth who participated in the Extended Foster Care program. The project reported on risk and protective factors for homelessness. This project was part of the State of Housing Instability and Homelessness Report series. You can read results here. | Housing and and Homelessness; Safety and Justice; Economy and Work | Bridget Anderson and Jenny Hutchison, Ph.D., Charlotte Urban Institute |
| Understanding proportionality and representation in Data Trust datasets (June 2025) | This project was the initial data request for the annual State of Our Data Report. The report serves as the annual report for the Data Trust shows who is represented in the data, how people are linked across datasets, and how the data are used. You can read previous reports here. | Education; Housing andHomelessness; Economy and Work; Safety and Justice | Sydney Idzikowski, Charlotte Urban Institute |
| The Influence of Tutoring Services on Elementary Students Below Grade Level Math (June 2025) | The project evaluated the effectiveness of Heart Math Tutoring, or HMT. HMT is a math tutoring program that works with dedicated volunteers to help elementary students develop foundational math skills. The project examined if there are differences in academic performance between students who receive tutoring through HMT and those who do not; whether the tutoring method and/or number of tutoring sessions affected academic performance. | Education; Economy and Work | Eric Moore, Ph.D., Charlotte Urban Institute |
| Good Jobs Charlotte - Workforce Development (December 2025) | This project sought to improve the understanding of local workforce development clients and their needs. The project examined the data that are collected by workforce agencies; the extent to which clients access workforce agencies; and what other community services do clients of workforce agencies engage with. This study focused on a critical issue: the fragmented nature of workforce development data. The project connected various information strands by highlighting this disjointed data environment, forming a unified representation that illustrates the challenges and opportunities within the local workforce landscape. | Economy and Work; Housing and Homelessness | Eric Moore, Ph.D., and Jenny Hutichson, Ph.D., Charlotte Urban Institute |
From Data to Impact - Student Emergency Fund - An Exploratory Analysis of Community Connections: The research findings shifted the UNC Charlotte Student Emergency Fund from an isolated, one-time fix into a proactive, cross-department tool for retention and student well-being. The Associate Vice Chancellor for Student Affairs and Dean of Students established Basic Needs Services as a dedicated new functional area, creating a centralized hub designed to streamline wrap-around support for students facing food insecurity and other basic needs. The findings served as a catalyst for deeper cross-departmental collaboration, prompting Student Assistance and Support Services to use applications as an opportunity to screen for broader vulnerabilities and connect students to community and campus resources based on their needs to ensure students under financial stress receive comprehensive mental health and academic support. The findings also highlighted that financial relief alone cannot ensure long-term stability. In response, the Student Emergency Fund is now paired with financial education and skill building through Niner Finances, helping students avoid future financial shocks during their academic career while equipping them with financial management skills for life beyond graduation. Moving beyond addressing immediate financial need, the university leveraged the data to better address the root causes of student need by building intentional bridges between crisis relief and long-term financial stability and well-being.
From Data to Impact - The Influence of Tutoring Services on Elementary Students Below Grade Level Math: While preparing for a randomized controlled trial study, Heart Math was grateful for the quick turnaround of the study with the Data Trust. The findings informed some important ways Heart Math can continue innovating and refining their programs. For example, the study highlighted that 40 tutoring sessions was an important threshold for student success. This is a factor guiding decision making about the best length of the program and how many sessions a student needs for the greatest impact. Additionally, the findings showed encouraging results, pinpointing areas of improvement, which supported Heart Math in focusing resources to curriculum innovation and adaptation. Overall, the study provided Heart Math with new information, helped validate the need for the RCT study, and informed where Heart Math should continue to innovate in refining their programming.
From Data to Impact - Transition age foster care youth and housing instability: This report supports Mecklenburg County’s research objectives through its cross-sectoral and intentional use of data to reveal populations that need the most housing support. To assist young adults aging out of foster care, our community needs to be creative in finding ways to connect with these young adults. Findings from this study reinforced the need for Mecklenburg County to maintain their Aged Out Youth program, a supportive housing program for youth who have aged out of or lived in foster care. The study encouraged the county to expand eligibility for the housing program to include youth who have experienced foster care (before eligibility was limited to those who aged out of foster care). Read more about the findings here: https://ui.charlotte.edu/2025/11/17/findings-from-new-reports-on-transition-age-foster-care-youth-and-homelessness/
Completed Institute Projects
In addition to the linked data projects described above, Institute researchers completed five research projects in 2025. The table below summarizes the projects that were completed in 2025. Links are provided where available.
| Project Name | Description | Domain(s) | PI(s) |
|---|---|---|---|
| Ascent Housing Impact Fund -Phase 1 (April 2025) | This project developed an evaluation framework to assess the overall influence of the Housing Impact Fund on the well-being of households within their communities. The evaluation framework prioritizes the monitoring and measurement of long-term impacts of housing stability, as well as measurements related to the Community Health Worker and peer-parenting education programs. | Housing and Homelessness | Jenny Niu |
| A Home for All (June 2025) | Provided data capacity building and support for six agencies involved with the community-wide effort to end homelessness and housing instability in Charlotte-Mecklenburg. The data capacity building will support the evaluation of the Initiative and help to ensure that high quality data is being collected ahead of, during, and after the evaluation. | Housing and Homelessness | Sydney Idzikowski |
| Knight Foundation West End News Ecosystem (July 2025) | This project investigated news sources and engagement, the information ecosystem in Charlotte’s West End, and whether that information ecosystem is meeting the needs of residents and businesses. Read the findings here. | Engagement | Angelique Gaines |
| Sugar Creek Charter School TIMS Computerized Bus Routing (June 2025) | The Institute’s TIMS staff assisted Sugar Creek Charter with training and software/data support services within the existing TIMS computerized bus routing software. | Transportation | Andrew McComery |
| Alternatives to Violence 3-Year Evaluation (December 2025) | The Institute evaluated the Alternatives to Violence program in Beatties Ford. This evaluation looked at three years of the program. Read the findings here. | Safety and Justice | Angelique Gaines, Fatima Rodrigues Caba |
Impact, Data, and Evaluation Academy
2025 marked the first full year of the Impact, Data and Evaluation Academy. IDEA provides low-cost, community-centered data and evaluation training that is designed with and for Charlotte-area nonprofits. In the past year, nearly 100 (n=96) organizations and 152 unique people participated in at least one IDEA offering. The organizations represent nonprofits, social impact organizations, universities and government agencies.
IDEA provided six types of services to participants in 2025. The table below shows the types of services and how many people received that service.
| Service | Service Description | Number of Services Offered | Number of participants |
|---|---|---|---|
| Newsletter | Quarterly newsletter distributed with information about upcoming offerings and sharing free evaluation resources | 4 | 83 |
| Workshop | Single or multi-day workshops covering a range of evaluation and data topics. | 3 | 54 |
| Webinar | Webinar focusing on strategic narratives | 1 | 33 |
| Evaluation Office Hours | Short consultation sessions designed to answer specific questions or provide more information to interested participants | 7 | 7 |
| Data Service | More enhanced and specific services like a logic model and evaluation plan | 2 | 1 |

CONCLUSION
The Institute and Data Trust’s State of Our Data report summarizes and describes our data ecosystem, our data and its use. The report itself is intended to be a tool, focusing not only on what we have completed and developed over the past year, but also on who is missing, what needs to be improved, where there are new opportunities for collaboration, and, critically, assess our impact. This report also annually reminds us that:
Our data are people. Whether describing people or the places they live, the data we hold, curate and use for research and decision-making reflect human lives. This brings added responsibility, both in terms of protecting the privacy of data, but also in using it so it benefits the people reflected.
Simple categories hold immense complexity. The categories that we often take for granted to describe who we and others are hold a great deal of nuance and complexity. Categories we use to describe characteristics like race and ethnicity help us standardize and compare data, but they can also oversimplify or erase important aspects of people’s identities and experiences. A community data infrastructure minds this tension and a resource like the Data Trust’s integrated data system has the capacity to help us better understand and recognize the level of detail and the people behind the categories.
Understanding representation is essential. When compared to Mecklenburg County, people who identify as Black or African American, or who are captured in multiracial categories are overrepresented in Data Trust data. People in our datasets are also disproportionately located in lower-income neighborhoods in Charlotte-Mecklenburg. In addition, people with higher incomes are underrepresented in our data. Understanding disproportionate representation matters for research methods, analysis, and interpretation. It also matters strategically for the Data Trust, particularly in the recruitment of new data partners, as well as board and committee members.
Understanding disproportionate overrepresentation in Data Trust data also points to the importance of understanding data in context and linking administrative data with other forms of data, like broader population data from the Quality of Life Explorer as well as more qualitative, contextual and historical data to build a fuller picture of the people in our community and their experiences. There is a bigger story that additional forms of data allow us to tell.
Organizations and services in our community are connected by the people they serve. Whether intentional or not, services in our community are linked by the people receiving them. Seeing those connections across programs and partners (or where there are not connections) allows us to ask questions about them to better coordinate services, observe gaps and better serve those in our community that are engaged in multiple organizations and systems.
A community data infrastructure requires ongoing commitment. The report details the extent of our partnerships and the wide variety of data required to develop and maintain an enduring community data infrastructure. Accessible people and place data across multiple, interconnected domains like housing, health and transportation requires more than one leader or one organization or one sector. The community infrastructure stewarded by the Institute and Data Trust and our partners is a community effort and a community commitment.
And last, but not least, we invite you to join us as a partner in this work. Use the QR code below to let us know if you are interested in becoming a data partner or learning more about using our community data. You can also email us at datatrust@charlotte.edu.

REFERENCES
Bovell-Ammon, A., Ettinger de Cuba, S., Coleman, S., Ahmad, N., Black, M. M., Frank, D. A., & Cutts, D. B. (2019). Trends in food insecurity and SNAP participation among immigrant families of US-born young children. Children, 6(4), 55.
Eubanks, V. (2018). Automating inequality: How high-tech tools profile, police, and punish the poor. St. Martin’s Press.
Fong, K. (2020). Getting eyes in the home: Child protective services investigations and state surveillance of family life. American Sociological Review, 85(4), 610-638.
Scott, R. H. (2024). The Evolution of Redlining in the United States Housing Market. Journal of Economic Issues, 58(2), 588–597. https://doi.org/10.1080/00213624.2024.2344442
Vargas, E. D., & Pirog, M. A. (2016). Mixed‐status families and WIC uptake: The effects of risk of deportation on program use. Social science quarterly, 97(3), 555-572.

Appendix A - Report Methods and Data Tables
Key Methodological Notes
The data included in this report is from an approved data license request. The Data Trust team submitted a data license request that was reviewed and approved by the Data and Research Oversight Committee. Data from the request will also be used to inform recruitment to the Community Data Advisory Committee.
The years referenced in this report are calendar years. Many of our data partners share data based on the calendar year. This report highlights January 1, 2025 through December 31, 2025.
Data Generation Process
The first part of the data generation process was to identify individuals represented in the Data Trust and to create a unique ID for every person. A person could have multiple data partner IDs, so the de-duplication process assigns IDs related to the same person to a globally unique ID. To accomplish this we used a similar process as the record linkage process described below. The normal record linkage process is used to identify the same person in two different datasets.-With the de-duplication, we search for common people within the records of the same dataset. Performing the de-duplication process allowed us to get a more accurate number of the amount of unique people in the dataset.
Record Linkage Process
The record linkage process involved connecting individuals present in different datasets. Since a common unique identifier, such as a social security number or email address, was not provided, the link primarily relied on names and birth dates to identify records representing the same person. Exact name-matching proved challenging due to variations in information such as typographical errors, shortened versions of first names (e.g., Sam vs. Samuel), or hyphenated last names where one dataset included only part of the last name while another had the full hyphenated version.
Names, dates of birth, race and gender were collected from datasets meeting the specified criteria. Names were cleaned by converting them to lowercase letters, removing whitespace and special characters, and separating multipart last names into individual records. For example, a record with the last name “Smith-Jones” was cleaned into “smith jones” and split into three records: one with “smith,” one with “jones,” and one retaining “smith jones.” Additionally, Soundex codes—a phonetic encoding method— were generated for all names. These codes facilitated the matching process by accounting for slight spelling differences, as they could produce the same code for similar-sounding names.
Race and gender categories were also standardized to address inconsistencies across data partners. For instance, one partner might categorize gender as “Male” and “Female,” while another used “M” and “F.” These categories were mapped to a common naming convention for consistent comparison. If individuals had multiple races, each race was treated as a separate record, similar to the approach for multipart last names. Consequently, a single person could be associated with multiple records. A unique key was generated for the cleaned dataset.
Once the data was cleaned, the next step involved identifying potential matching candidates. For large datasets, comparing all possible record combinations would have been computationally expensive due to the sheer volume. To narrow down the list of potential matches, subsets of fields were used: combinations of birth date with the Soundex code for first names and birth date with the Soundex code for last names. Birth dates had to match exactly, while the Soundex codes employed a Sorted Neighborhood Index to identify the closest matches, even when minor variations existed.
The resulting candidate list contained pairs of unique keys from both datasets to compare additional fields. These fields included first, middle, and last names, which were evaluated using string similarity methods that generate a score. The fields were identified as matches if the score exceeded a set threshold. We also include exact matching on the first, middle and last name fields because in some cases you may have twins where all the information is the same except for first and middle names.-The middle name may not always exist or be provided and in some cases the first name between the two records is only different by one letter.-Lets for example say that we have two records in Dataset A and also two records in Dataset B where each record represents a twin with very similar first names.-When running the comparison using only string similarity it is likely that the two records from Dataset A will match with both records in Dataset B and the process will deduplicate them into one ISC_ID. If we also add exact matching since the first name is slightly different, matching between datasets will generate different match scores since one record combination will match exactly and one will not.-This acts as kind of a tie breaker when we choose the highest scoring match candidate to determine the final matches.
Soundex codes for names, as well as birth date, race, and gender fields, required exact matches. Since birth dates were already exact matches from the candidate selection step, all potential matches shared this attribute. The standardization of race and gender fields ensured accurate comparisons.
After comparing records, a table of binary fields was generated, with columns indicating whether each field matched (1) or did not match (0). A weighted match score was calculated, prioritizing name fields, and ranged from 0 to 1, with 1 representing a perfect match. The table was also analyzed using a classification model to categorize records as either “No Match” (0) or “Match” (1). Each record linkage dataset combination was examined to determine the threshold to use when classifying the combinations as a “Match.”
In the matched dataset, checks were performed to ensure that an ID from one dataset did not match multiple IDs from the other. In cases of multiple matches, the record with the highest match score was retained, and others were excluded. If scores were identical, the records were treated as representing the same individual and assigned the same ISC_ID. The final dataset included matches and non- matches, with an ISC_ID assigned to each unique person. Matched individuals shared a common ISC_ID across both datasets. This final dataset was saved to a file and linked to subsequent outputs.
De-duplication Process
How we determine unique people in each dataset is not just a count of how many data partner provided IDs related to people there are in each dataset.-There are a few scenarios we have noticed when examining the data partner provided IDs.-The first is that sometimes there may be typos where characters that represent the IDs are not exactly the same from one deposit year to the other. The second is that IDs may not always be provided in the data or the data partner doesn’t track IDs for the person.-In this case we would have to create a unique ID for the person and if that person is in multiple years of deposits they would have a different unique ID each year.-The third scenario is that having multiple IDs for a person is part of the data partners business process.-In this scenario an ID related to the person is created based on each interaction with the data partners system.-So if they have an interaction with the system a new ID is generated each time.-With every scenario, this results in the same person now having multiple IDs. If we were to just take a count of how many unique IDs there are as a representation of the number of people we would be overcounting how many people there are actually in each dataset.
We have developed a process where we use de-duplication to find IDs that represent the same person and store them into a common ID called a “dedup id” in a de-duplication table. The number of rows in the de-duplication table is based on how many unique data partner provided IDs there are in the person table since each ID gets assigned a “dedup id”. The de-duplication table will have two columns, the original data partner provided ID field and the “dedup id” field.-So for example if for dataset A there is a person table that has a field called ID and the id’s 100, 105 and 130 are found to represent the same person, then there would be a person_dedup table with the fields “id” and “id_dedup_id” and the records for 100, 105 and 130 would be mapped to the same “dedup id” value.
How we do this is through the record linkage process we have developed, which is used most commonly in the Data License Requests (DLR) such as the State of Our Data report. Record linkage involves comparing two datasets to find common people. This slightly different process is based on the same concepts with the difference being that we are finding common people within the same dataset. Based on the results of the de-duplication, IDs that represent the same person will be assigned a common “dedup id”. We run this de-duplication process for every dataset in the Data Trust and use the “dedup id” as the main ID used in running the record linkage process for DLRs. Since this process is tied to our record linkage process as we improve the models used to predict matches or make any other enhancements to the process it may result in different de-duplication ID assignments.-This would explain if you see a count for any of the years in last year’s State of Our Data report that is not the exact same number in the 2025 State of Our Data report. Another possible reason for different counts between reports is that some datasets get replaced completely every year while some are incremental updates year after year. For datasets that get replaced completely there may be changes that are made in the data partners system where some records are added or removed for various reasons which can result in information about the representation of people in the dataset changing.
Data Partner Legend – Abbreviations and Colors

How many unique people are reflected in our administrative data?
Count of Unique Individuals Overall
Using the year field to filter the dataset for records between 2016 and 2025 a table is created for each dataset that will contain the ISC_ID and a record for each year they are in the dataset. The tables are aggregated together into one dataset with a unique record for each ISC_ID and year the person is in each dataset. The table is then grouped by year and a count of every ISC_ID per year is calculated and reported below.
To obtain the Mecklenburg County population, we used the American Community Survey 1-year estimates.
Figure 3
| CATEGORY | DATA_YEAR | NUMBER_OF_PEOPLE | PERCENTAGE_OF_MECKLENBURG_COUNTY |
|---|---|---|---|
| Unique People in Data Trust | 2016 | 412452 | 40.8 |
| Unique People in Data Trust | 2017 | 398908 | 38.6 |
| Unique People in Data Trust | 2018 | 395340 | 37.5 |
| Unique People in Data Trust | 2019 | 388306 | 36.1 |
| Unique People in Data Trust | 2020 | 380683 | 34.8 |
| Unique People in Data Trust | 2021 | 397884 | 36.1 |
| Unique People in Data Trust | 2022 | 422839 | 37.9 |
| Unique People in Data Trust | 2023 | 419337 | 36 |
| Unique People in Data Trust | 2024 | 414474 | 34.4 |
| Unique People in Data Trust | 2025 | 397572 | 33 |
| Mecklenburg County Population | 2016 | 1011761 | |
| Mecklenburg County Population | 2017 | 1034311 | |
| Mecklenburg County Population | 2018 | 1054185 | |
| Mecklenburg County Population | 2019 | 1074384 | |
| Mecklenburg County Population | 2020 | 1095192 | |
| Mecklenburg County Population | 2021 | 1101084 | |
| Mecklenburg County Population | 2022 | 1115332 | |
| Mecklenburg County Population | 2023 | 1163789 | |
| Mecklenburg County Population | 2024 | 1206285 | |
| Mecklenburg County Population | 2025 | 1206285 |
Count of Unique Individuals by Data Partner
Using the year field to filter the dataset for records between 2016 and 2025 a table is created for each data partner dataset that will contain the ISC_ID and a record for each year they are in the dataset. The data is combined into one main table where all data partners are present. The data partner and year fields are used to group the data and get the count of the number of ISC_IDs represented in each data partner’s dataset for every year between 2016 and 2025. The most recent year of available data is returned in the table below.
Figure 4
| DATASET | DATA_YEAR | NUMBER_OF_PEOPLE |
|---|---|---|
| DCR - ES | 2025 | 210580 |
| CMS | 2025 | 169481 |
| Crisis | 2025 | 47940 |
| CMPD | 2025 | 44763 |
| MCSO - Booking | 2024 | 14958 |
| CFAS - ANI | 2025 | 11952 |
| HMIS | 2025 | 10337 |
| INLIVIAN | 2025 | 5084 |
| MCSO - Arrest | 2022 | 4506 |
| GW | 2025 | 4009 |
| HC | 2025 | 1334 |
| CFAS - FIHS | 2025 | 959 |
| Habitat - CHR | 2025 | 215 |
| CFAS - CIC | 2025 | 206 |
| Habitat - Homeowner | 2025 | 167 |
| LNA | 2025 | 139 |
| House CLT | 2025 | 101 |
What are the characteristics of the people in the Data Trust’s administrative data?
Here we explore the race, ethnicity, gender, age, geography and income characteristics of the people in the Data Trust.
Normalization: The data collected about people’s characteristics may vary from partner to partner. The Data Trust normalizes these data, meaning we make methodological decisions to standardize the data so they can be grouped and compared. Namely, we normalize the names of the racial, ethnic and gender groups because there is variation across data partners. The Data Trust acknowledges the need to standardize data as well as the risk of doing so, particularly when it can obscure and oversimplify identities.
Representation: In several places, this report describes proportionate representation and disproportionate overrepresentation or underrepresentation. This refers to how the data we hold compares to data on the overall population of the county or the particular area we are describing. Understanding representation is important in the use and interpretation of Data Trust data.
Race
For each race a query is provided to get the data from the Race_Ethnicity_Gender table. For each specific race the data obtained represents ISC_IDs that only report as the one race. The category Two or More Races as the name suggests represents ISC_IDs that are linked to multiple races in the Race_Ethnicity_Gender table. That data in Figure 6 contains the output for only the most recent year in the State of Our Data report (2025). Figure 7 represents all years in the State of Our Data Report (2016-2025). The percentage is calculated by dividing the number of people in each category by the total number of ISC_IDs during that record’s year. Since each race category represents only people that represent the one race the percentages will add up to 100%.
Figure 6
| DATA_YEAR | RACE | NUMBER_OF_PEOPLE | PERCENTAGE_OF_PEOPLE |
|---|---|---|---|
| 2025 | American Indian or Alaska Native | 607 | 0.2 |
| 2025 | Asian | 17304 | 4.4 |
| 2025 | Black or African American | 185388 | 46.6 |
| 2025 | Blank | 357 | 0.1 |
| 2025 | Hispanic or Latino | 37670 | 9.5 |
| 2025 | Native Hawaiian or Pacific Islander | 281 | 0.1 |
| 2025 | Two or more races | 63078 | 15.9 |
| 2025 | Unknown | 6230 | 1.6 |
| 2025 | White | 86657 | 21.8 |
Figure 7
For the purposes of this chart and section, all people with more than one race are in the Two or more races category.
| DATA_YEAR | RACE | NUMBER_OF_PEOPLE | PERCENTAGE_OF_PEOPLE |
|---|---|---|---|
| 2016 | American Indian or Alaska Native | 617 | 0.1 |
| 2016 | Asian | 17559 | 4.3 |
| 2016 | Black or African American | 200000 | 48.5 |
| 2016 | Blank | 366 | 0.1 |
| 2016 | Hispanic or Latino | 24100 | 5.8 |
| 2016 | Native Hawaiian or Pacific Islander | 203 | 0 |
| 2016 | Two or more races | 58442 | 14.2 |
| 2016 | Unknown | 4084 | 1 |
| 2016 | White | 107081 | 26 |
| 2017 | American Indian or Alaska Native | 528 | 0.1 |
| 2017 | Asian | 17466 | 4.4 |
| 2017 | Black or African American | 190134 | 47.7 |
| 2017 | Blank | 525 | 0.1 |
| 2017 | Hispanic or Latino | 24611 | 6.2 |
| 2017 | Native Hawaiian or Pacific Islander | 208 | 0.1 |
| 2017 | Two or more races | 59886 | 15 |
| 2017 | Unknown | 4346 | 1.1 |
| 2017 | White | 101204 | 25.4 |
| 2018 | American Indian or Alaska Native | 525 | 0.1 |
| 2018 | Asian | 17785 | 4.5 |
| 2018 | Black or African American | 187527 | 47.4 |
| 2018 | Blank | 452 | 0.1 |
| 2018 | Hispanic or Latino | 24966 | 6.3 |
| 2018 | Native Hawaiian or Pacific Islander | 242 | 0.1 |
| 2018 | Two or more races | 61690 | 15.6 |
| 2018 | Unknown | 3800 | 1 |
| 2018 | White | 98353 | 24.9 |
| 2019 | American Indian or Alaska Native | 505 | 0.1 |
| 2019 | Asian | 17766 | 4.6 |
| 2019 | Black or African American | 181990 | 46.9 |
| 2019 | Blank | 499 | 0.1 |
| 2019 | Hispanic or Latino | 27012 | 7 |
| 2019 | Native Hawaiian or Pacific Islander | 251 | 0.1 |
| 2019 | Two or more races | 61488 | 15.8 |
| 2019 | Unknown | 3830 | 1 |
| 2019 | White | 94965 | 24.5 |
| 2020 | American Indian or Alaska Native | 482 | 0.1 |
| 2020 | Asian | 17677 | 4.6 |
| 2020 | Black or African American | 180102 | 47.3 |
| 2020 | Blank | 819 | 0.2 |
| 2020 | Hispanic or Latino | 27557 | 7.2 |
| 2020 | Native Hawaiian or Pacific Islander | 240 | 0.1 |
| 2020 | Two or more races | 61015 | 16 |
| 2020 | Unknown | 3191 | 0.8 |
| 2020 | White | 89600 | 23.5 |
| 2021 | American Indian or Alaska Native | 558 | 0.1 |
| 2021 | Asian | 18028 | 4.5 |
| 2021 | Black or African American | 192349 | 48.3 |
| 2021 | Blank | 796 | 0.2 |
| 2021 | Hispanic or Latino | 26899 | 6.8 |
| 2021 | Native Hawaiian or Pacific Islander | 247 | 0.1 |
| 2021 | Two or more races | 63484 | 16 |
| 2021 | Unknown | 3345 | 0.8 |
| 2021 | White | 92178 | 23.2 |
| 2022 | American Indian or Alaska Native | 630 | 0.1 |
| 2022 | Asian | 18771 | 4.4 |
| 2022 | Black or African American | 205464 | 48.6 |
| 2022 | Blank | 1068 | 0.3 |
| 2022 | Hispanic or Latino | 29325 | 6.9 |
| 2022 | Native Hawaiian or Pacific Islander | 276 | 0.1 |
| 2022 | Two or more races | 67467 | 16 |
| 2022 | Unknown | 4580 | 1.1 |
| 2022 | White | 95258 | 22.5 |
| 2023 | American Indian or Alaska Native | 668 | 0.2 |
| 2023 | Asian | 18111 | 4.3 |
| 2023 | Black or African American | 200052 | 47.7 |
| 2023 | Blank | 1378 | 0.3 |
| 2023 | Hispanic or Latino | 31882 | 7.6 |
| 2023 | Native Hawaiian or Pacific Islander | 287 | 0.1 |
| 2023 | Two or more races | 66779 | 15.9 |
| 2023 | Unknown | 6327 | 1.5 |
| 2023 | White | 93853 | 22.4 |
| 2024 | American Indian or Alaska Native | 639 | 0.2 |
| 2024 | Asian | 17959 | 4.3 |
| 2024 | Black or African American | 191976 | 46.3 |
| 2024 | Blank | 517 | 0.1 |
| 2024 | Hispanic or Latino | 37333 | 9 |
| 2024 | Native Hawaiian or Pacific Islander | 272 | 0.1 |
| 2024 | Two or more races | 66251 | 16 |
| 2024 | Unknown | 6815 | 1.6 |
| 2024 | White | 92712 | 22.4 |
| 2025 | American Indian or Alaska Native | 607 | 0.2 |
| 2025 | Asian | 17304 | 4.4 |
| 2025 | Black or African American | 185388 | 46.6 |
| 2025 | Blank | 357 | 0.1 |
| 2025 | Hispanic or Latino | 37670 | 9.5 |
| 2025 | Native Hawaiian or Pacific Islander | 281 | 0.1 |
| 2025 | Two or more races | 63078 | 15.9 |
| 2025 | Unknown | 6230 | 1.6 |
| 2025 | White | 86657 | 21.8 |
Figure 8
| DATA_YEAR | RACE | CATEGORY | NUMBER_OF_PEOPLE | PERCENTAGE_OF_PEOPLE |
|---|---|---|---|---|
| 2025 | American Indian or Alaska Native | Data Trust | 607 | 0.2 |
| 2025 | American Indian or Alaska Native | Mecklenburg County | 1430 | 0.1 |
| 2025 | Asian | Data Trust | 17304 | 4.4 |
| 2025 | Asian | Mecklenburg County | 78941 | 6.5 |
| 2025 | Black or African American | Data Trust | 185388 | 46.6 |
| 2025 | Black or African American | Mecklenburg County | 349848 | 29 |
| 2025 | Hispanic or Latino | Data Trust | 37670 | 9.5 |
| 2025 | Hispanic or Latino | Mecklenburg County | 204920 | 17 |
| 2025 | Multi-Racial | Data Trust | 63078 | 15.9 |
| 2025 | Multi-Racial | Mecklenburg County | 53293 | 4.4 |
| 2025 | Native Hawaiian or Other Pacific Islander | Data Trust | 281 | 0.1 |
| 2025 | Native Hawaiian or Other Pacific Islander | Mecklenburg County | 534 | 0 |
| 2025 | Other race, unknown, or blank | Data Trust | 6587 | 1.7 |
| 2025 | Other race, unknown, or blank | Mecklenburg County | 7959 | 0.7 |
| 2025 | White | Data Trust | 86657 | 21.8 |
| 2025 | White | Mecklenburg County | 509360 | 42.2 |
Figure 9
This figure will report the race of people based on the overall count and the number of people that were linked to more than one dataset using the most recent year in the State of Our Data report (2025). For each specific race the data obtained represents ISC_IDs that only report as the one race.-The category Two or More Races as the name suggests represents ISC_IDs that are linked to multiple races in the Race_Ethnicity_Gender table.-The data is calculated by getting the ISC_IDs and dataset records related to 2025 and creating a pivot table on the dataset column, where the dataset columns are a binary field indicating if the ISC_ID is present in each dataset.-This information is joined with the Race_Ethnicity_Gender table and can be used to get the “Overall” count of people and then filtered by ISC_IDs that are linked to multiple datasets to calculate the ”2+ datasets” count.
| DATA_YEAR | RACE | NUMBER_OF_PEOPLE | PERCENTAGE_OF_PEOPLE | CATEGORY |
|---|---|---|---|---|
| 2025 | American Indian or Alaska Native | 607 | 0.2 | Overall |
| 2025 | Asian | 17304 | 4.4 | Overall |
| 2025 | Black or African American | 185388 | 46.6 | Overall |
| 2025 | Blank | 357 | 0.1 | Overall |
| 2025 | Hispanic or Latino | 37670 | 9.5 | Overall |
| 2025 | Native Hawaiian or Pacific Islander | 281 | 0.1 | Overall |
| 2025 | Two or more races | 63078 | 15.9 | Overall |
| 2025 | Unknown | 6230 | 1.6 | Overall |
| 2025 | White | 86657 | 21.8 | Overall |
| 2025 | American Indian or Alaska Native | 30 | 0 | 2+ datasets |
| 2025 | Asian | 1598 | 1.8 | 2+ datasets |
| 2025 | Black or African American | 53014 | 59.7 | 2+ datasets |
| 2025 | Blank | 1 | 0 | 2+ datasets |
| 2025 | Hispanic or Latino | 1479 | 1.7 | 2+ datasets |
| 2025 | Native Hawaiian or Pacific Islander | 5 | 0 | 2+ datasets |
| 2025 | Two or more races | 27499 | 31 | 2+ datasets |
| 2025 | Unknown | 17 | 0 | 2+ datasets |
| 2025 | White | 5090 | 5.7 | 2+ datasets |
Understanding Multiple Racial and Ethnic Identities
The data was calculated by going through each racial/ethnic category and generating counts based on two conditions, the first was how many ISC_IDs only represent the one Racial/Ethnic category. For example in the first record of Figure 10 the Target Race/Ethnic Identity and Other Race/Ethnic Identity fields are both American Indian which means this is the amount of ISC_IDs that are only represented as American Indian and no other racial/ethnic identities. The second condition was how many ISC_IDs represent multiple racial/ethnic identities category combinations. For example, records 2-7 in Figure 10 represent the number of people represented as American Indian and a different racial/ethnic identity.
Figure 10
The chart was created using the counts of people and their identified racial/ethnic groups. Each race/ethnicity is represented by a segment of the circle. The size of the segment is proportional to the total count of people of a given race/ethnicity. People who identified with more than one race or ethnicity are represented using chords that connect the segments, with their thickness representing the total count of a given pair of ethnicity. Due to size limitations, some race/ethnic names needed to be changed. A crosswalk of the different names are below:
Black refers to the Black or African American group
Pacific Islander refers to the Native Hawaiian or Other Pacific Islander group
American Indian refers to the American Indian or Alaska Native group
| Target Race/Ethnic Identity | Other Race/Ethnic Identity | Count |
|---|---|---|
| American Indian | American Indian | 2611 |
| American Indian | Asian | 487 |
| American Indian | Black | 4766 |
| American Indian | Hispanic | 1317 |
| American Indian | Pacific Islander | 289 |
| American Indian | Multi-Racial | 21 |
| American Indian | White | 3228 |
| Asian | Asian | 47418 |
| Asian | Black | 2959 |
| Asian | Hispanic | 721 |
| Asian | Pacific Islander | 354 |
| Asian | Multi-Racial | 169 |
| Asian | White | 3647 |
| Black | Black | 502746 |
| Black | Hispanic | 13493 |
| Black | Pacific Islander | 1283 |
| Black | Multi-Racial | 2626 |
| Black | White | 27356 |
| Blank | Blank | 6434 |
| Hispanic | Hispanic | 105614 |
| Hispanic | Pacific Islander | 552 |
| Hispanic | Multi-Racial | 42 |
| Hispanic | White | 57736 |
| Pacific Islander | Pacific Islander | 952 |
| Pacific Islander | Multi-Racial | 10 |
| Pacific Islander | White | 957 |
| Multi-Racial | Multi-Racial | 7668 |
| Multi-Racial | White | 1019 |
| Unknown | Unknown | 33529 |
| White | White | 350184 |
The Sankey visualizations below are created for every race and will show how races are linked to each other. Similar to the chord diagram, each Sankey chart takes the total count of people in a given race/ethnicity and shows the relative proportion of people who identify with a single race and those who identify with other race/ethnicity categories. Larger ‘flows’ in a given race/ethnicity’s chart to other races/ethnicities represent higher incidence of multiracial identification.
Figure 11
| Target Racial/Ethnic Category | Other Racial/Ethnic Category | Percent |
|---|---|---|
| American Indian | Black | 0.9 |
| Asian | Black | 0.5 |
| Black | Black only | 90.5 |
| Black | Hispanic | 2.4 |
| Black | Pacific Islander | 0.2 |
| Black | Multi-Racial | 0.5 |
| Black | White | 4.9 |
| American Indian | White | 0.7 |
| Asian | White | 0.8 |
| Black | White | 6.2 |
| Hispanic | White | 13 |
| Pacific Islander | White | 0.2 |
| Multi-Racial | White | 0.2 |
| White | White only | 78.8 |
| American Indian | Asian | 0.9 |
| Asian | Asian only | 85 |
| Asian | Black | 5.3 |
| Asian | Hispanic | 1.3 |
| Asian | Pacific Islander | 0.6 |
| Asian | Multi-Racial | 0.3 |
| Asian | White | 6.5 |
| American Indian | Multi-Racial | 0.2 |
| Asian | Multi-Racial | 1.5 |
| Black | Multi-Racial | 22.7 |
| Hispanic | Multi-Racial | 0.4 |
| Pacific Islander | Multi-Racial | 0.1 |
| Multi-Racial | Multi-Racial only | 66.4 |
| Multi-Racial | White | 8.8 |
| American Indian | American Indian only | 20.5 |
| American Indian | Asian | 3.8 |
| American Indian | Black | 37.5 |
| American Indian | Hispanic | 10.4 |
| American Indian | Pacific Islander | 2.3 |
| American Indian | Multi-Racial | 0.2 |
| American Indian | White | 25.4 |
| American Indian | Pacific Islander | 6.6 |
| Asian | Pacific Islander | 8.1 |
| Black | Pacific Islander | 29.2 |
| Hispanic | Pacific Islander | 12.6 |
| Pacific Islander | Pacific Islander only | 21.7 |
| Pacific Islander | Multi-Racial | 0.2 |
| Pacific Islander | White | 21.8 |
| American Indian | Hispanic | 0.7 |
| Asian | Hispanic | 0.4 |
| Black | Hispanic | 7.5 |
| Hispanic | Hispanic only | 58.8 |
| Hispanic | Pacific Islander | 0.3 |
| Hispanic | Multi-Racial | 0 |
| Hispanic | White | 32.2 |
Gender
This output will get the number of people that are associated with only one type of gender and calculate the percentage. For the Unknown category this combines the records that are only Unknown, Blank and records with more than one gender. The counts will add up to the total number of people in all the datasets.
Figure 12
| DATA_YEAR | GENDER | NUMBER_OF_PEOPLE | PERCENTAGE_OF_PEOPLE |
|---|---|---|---|
| 2025 | A gender other than singularly male or female | 14 | 0 |
| 2025 | Female | 207764 | 52.26 |
| 2025 | Male | 183576 | 46.17 |
| 2025 | Unknown | 6218 | 1.56 |
Age
Figure 19 will provide age statistics (min, median, max) for each dataset in the DLR using the dataset’s latest available year.-For most datasets this is 2025, with the exception of MCSO - Arrest (2022) and MCSO - Booking (2024). Also for Lakeview Neighborhood Alliance (LNA) we received data for 2025 but only for adults, which is why the minimum age is 19.-For each dataset a table filtered by the latest available year is created with the ISC_ID and Age fields. The age field is used to calculate the quantile values for the 1st and 99th percentile and this will represent the lower and upper bounds of acceptable values.-The upper and lower bounds are calculated for each dataset table separately.-These values are then used to filter out the outliers that fall outside the upper and lower bounds for the records related to the dataset table. Then the statistics are generated on the filtered table.
Figure 13
| DATASET | MIN | MEDIAN | MAX |
|---|---|---|---|
| CFAS - ANI | 0 | 8 | 17 |
| CFAS - CIC | 0 | 8 | 18 |
| CFAS - FIHS | 0 | 7 | 17 |
| CMPD | 18 | 35 | 79 |
| CMS | 4 | 11 | 18 |
| Crisis | 20 | 39 | 76 |
| DCR - ES | 0 | 22 | 82 |
| GW | 18 | 37 | 72 |
| HC | 19 | 42 | 74 |
| HMIS | 0 | 34 | 72 |
| Habitat - CHR | 35 | 68 | 92 |
| Habitat - Homeowner | 2 | 15 | 61 |
| House CLT | 23 | 35 | 66 |
| INLIVIAN | 6 | 37 | 77 |
| LNA | 19 | 57 | 85 |
| MCSO - Arrest | 18 | 31 | 63 |
| MCSO - Booking | 18 | 32 | 65 |
Where do people in the Data Trust live?
Figure 14 and 15
To understand which parts of Charlotte/Mecklenburg County are represented by the Data Trust data, we geocoded the addresses in the datasets and aggregated them to neighborhood profile areas (NPAs). Location data is not available with all partners. The address data used in this section is from CMS, DCR – ES, Crisis, CMPD, Habitat - CHR, Habitat - Homeowner, House CLT, Housing Collaborative (HC), INLIVIAN and Lakeview Neighborhood Alliance (LNA). We used records from 2025, the most recent year available for this analysis, to calculate the number of unique individuals in each Neighborhood Profile Area (NPA).
Representation Maps
For each dataset, we used records from 2025, the most recent year available for this analysis. Population estimates were obtained from the 2024 American Community Survey (ACS) five-year estimates using total population variable B01003_001E. We restricted these estimates to Mecklenburg County and aggregated them to NPAs using a geographic crosswalk. The youth population distribution map from the Quality of Life Explorer for the latest year available (2023) was obtained to provide estimates of the proportion of residents who were youth. This is needed for the CMS representation estimate.
To assess representation, we calculated each NPA’s share of Mecklenburg County’s total population as a reference. We then calculated each NPA’s share of the unique individuals in each dataset and compared it with the reference share. For example, an NPA containing 1% of the county’s population and 1% of the unique individuals in the Crisis dataset would be considered proportionately represented.
Given the wide variation in population concentrations in NPAs as well as potential missing value and address quality issues, the maps represent only a rough estimate of representation. Thus, we give a margin of error of 30% and classify any NPA within 30% of the population proportion as proportionately represented. Any NPA above 30% is over represented and any NPA below 30% is considered underrepresented.
Detailed data tables are available on request.
What do we know about the income levels of the people represented in the Data Trust?
Figure 16
For this analysis, we used NPA-level median household income estimates from the Quality of Life Explorer for 2023, the latest year available in our database. The data classifies NPAs into three groups based on median household income: the lowest income third, middle income third and highest income third. Representation patterns were displayed as a hatched overlay on the income map to explore how dataset representation varies across income groups. The underlying data table is available upon request.
How are people reflected across partners?
Figure 17
This figure will report the percentage of people based on the number of datasets they are associated with during the most recent year of the State of Our Data report (2025). A dataset containing the ISC_IDs and the datasets and years they are associated with is loaded and filtered to include only 2025. A pivot table is then created where a record is created for every ISC_ID and a binary column is created for each dataset where the value is 1 if the ISC_ID is associated with the dataset and 0 if it is not. The binary dataset columns are summed across and stored in a field called NUMBER_OF_DATASETS to indicate how many datasets an ISC_ID is associated with. The NUMBER_OF_DATASETS is grouped into a category where the values 1, 2 and 3 remain the same value, but records where NUMBER_OF_DATASETS >= 4 are set to the value 4+.-The table is then grouped by NUMBER_OF_DATASETS and then aggregated by summing the NUMBER_OF_PEOPLE.
| NUMBER_OF_DATASETS | NUMBER_OF_PEOPLE | PERCENTAGE_OF_PEOPLE |
|---|---|---|
| 1 | 308839 | 77.7 |
| 2 | 70810 | 17.8 |
| 3 | 15245 | 3.8 |
| 4+ | 2678 | 0.7 |
Figure 18
This figure will report the percentage of people based on the number of datasets they are associated with using all years that were part of the State of Our Data report (2016-2025). A table containing a record for every ISC_ID and binary columns for every dataset indicating if they are associated the dataset is created and used in this calculation. The binary dataset columns are summed across and stored in a field called NUMBER_OF_DATASETS to indicate how many datasets an ISC_ID is associated with. The NUMBER_OF_DATASETS is grouped into a category where the values 1, 2 and 3 remain the same value, but records where NUMBER_OF_DATASETS >= 4 are set to the value 4+.-The table is then grouped by NUMBER_OF_DATASETS and then aggregated by summing the NUMBER_OF_PEOPLE.
| NUMBER_OF_DATASETS | NUMBER_OF_PEOPLE | PERCENTAGE_OF_PEOPLE |
|---|---|---|
| 1 | 770058 | 66.3 |
| 2 | 213643 | 18.4 |
| 3 | 102913 | 8.9 |
| 4+ | 75205 | 6.5 |
Overlap by Data Partners
The following figures represent the overlap of how people are connected with the datasets in the State of Our Data report. Tables are created for each dataset where the table provides percentages of how many people from the Target Data Partner dataset are also associated with other Linked Data Partner datasets using the Target Data Partner dataset’s latest available year.-In most cases this is 2025 with the exception of MCSO - Arrest (2022) and MCSO - Booking (2024).-
The process runs for each dataset (Target Data Partner dataset) and a table is generated that has all the ISC_IDs filtered by the latest available year. Another table is generated that has the ISC_IDs related to all other datasets and also includes the year information.-The two tables are filtered on the ISC_ID and Year field which means that for other dataset’s overlap to be counted the ISC_ID must be present in multiple datasets during the same year as the Target Data Partner.-The process will calculate the overlap between the datasets, but also create a new category called “No Overlap” based on ISC_IDs that did not match across datasets. A table is returned containing the Target Data Partner dataset, the Linked Data Partner datasets (including the No Overlap category), the count of the number of people and the percentage. Records where there were counts less than 10 were dropped from the output.
For example, with HMIS, there were 10,337 people in 2025-and 57% of the people in the HMIS dataset matched with the DCR - ES dataset in 2025. The percent overlap for DCR - ES is calculated by dividing the 5,897 people by the 10,337 total people in the HMIS dataset in 2025.
Figures 19 and 20
| Target Data Partner | Linked Data Partner | Count | Percent |
|---|---|---|---|
| HMIS | DCR - ES | 5897 | 57 |
| HMIS | No Overlap | 3382 | 32.7 |
| HMIS | Crisis | 2463 | 23.8 |
| HMIS | CMS | 1219 | 11.8 |
| HMIS | CMPD | 884 | 8.6 |
| HMIS | CFAS - ANI | 475 | 4.6 |
| HMIS | HC | 376 | 3.6 |
| HMIS | INLIVIAN | 288 | 2.8 |
| HMIS | GW | 234 | 2.3 |
| HMIS | CFAS - FIHS | 60 | 0.6 |
| HMIS | CFAS - CIC | 28 | 0.3 |
| CMS | No Overlap | 114699 | 67.7 |
| CMS | DCR - ES | 50457 | 29.8 |
| CMS | Crisis | 10644 | 6.3 |
| CMS | CFAS - ANI | 6005 | 3.5 |
| CMS | HMIS | 1219 | 0.7 |
| CMS | CFAS - FIHS | 535 | 0.3 |
| CMS | CMPD | 267 | 0.2 |
| CMS | CFAS - CIC | 82 | 0 |
| CMS | INLIVIAN | 41 | 0 |
| CMS | GW | 34 | 0 |
| CMS | Habitat - Homeowner | 27 | 0 |
| Crisis | DCR - ES | 27465 | 57.3 |
| Crisis | No Overlap | 16863 | 35.2 |
| Crisis | CMS | 10644 | 22.2 |
| Crisis | HMIS | 2463 | 5.1 |
| Crisis | CMPD | 2414 | 5 |
| Crisis | CFAS - ANI | 1978 | 4.1 |
| Crisis | INLIVIAN | 465 | 1 |
| Crisis | GW | 421 | 0.9 |
| Crisis | CFAS - FIHS | 221 | 0.5 |
| Crisis | HC | 203 | 0.4 |
| Crisis | CFAS - CIC | 37 | 0.1 |
| Crisis | LNA | 22 | 0 |
| Crisis | Habitat - CHR | 14 | 0 |
| GW | No Overlap | 2525 | 63 |
| GW | DCR - ES | 1238 | 30.9 |
| GW | Crisis | 421 | 10.5 |
| GW | CMPD | 241 | 6 |
| GW | HMIS | 234 | 5.8 |
| GW | INLIVIAN | 35 | 0.9 |
| GW | CMS | 34 | 0.8 |
| GW | HC | 26 | 0.6 |
| Habitat - Homeowner | No Overlap | 120 | 71.9 |
| Habitat - Homeowner | CMS | 27 | 16.2 |
| Habitat - Homeowner | DCR - ES | 23 | 13.8 |
| Habitat - CHR | No Overlap | 145 | 67.4 |
| Habitat - CHR | DCR - ES | 63 | 29.3 |
| Habitat - CHR | Crisis | 14 | 6.5 |
| DCR - ES | No Overlap | 128301 | 60.9 |
| DCR - ES | CMS | 50457 | 24 |
| DCR - ES | Crisis | 27465 | 13 |
| DCR - ES | CMPD | 7691 | 3.7 |
| DCR - ES | CFAS - ANI | 6850 | 3.3 |
| DCR - ES | HMIS | 5897 | 2.8 |
| DCR - ES | INLIVIAN | 1638 | 0.8 |
| DCR - ES | GW | 1238 | 0.6 |
| DCR - ES | CFAS - FIHS | 740 | 0.4 |
| DCR - ES | HC | 507 | 0.2 |
| DCR - ES | CFAS - CIC | 119 | 0.1 |
| DCR - ES | LNA | 66 | 0 |
| DCR - ES | Habitat - CHR | 63 | 0 |
| DCR - ES | Habitat - Homeowner | 23 | 0 |
| DCR - ES | House CLT | 10 | 0 |
| CFAS - ANI | DCR - ES | 6850 | 57.3 |
| CFAS - ANI | CMS | 6005 | 50.2 |
| CFAS - ANI | No Overlap | 2876 | 24.1 |
| CFAS - ANI | Crisis | 1978 | 16.5 |
| CFAS - ANI | CFAS - FIHS | 853 | 7.1 |
| CFAS - ANI | HMIS | 475 | 4 |
| CFAS - ANI | CFAS - CIC | 164 | 1.4 |
| CFAS - ANI | INLIVIAN | 12 | 0.1 |
| CFAS - ANI | CMPD | 10 | 0.1 |
| CFAS - FIHS | CFAS - ANI | 853 | 88.9 |
| CFAS - FIHS | DCR - ES | 740 | 77.2 |
| CFAS - FIHS | CMS | 535 | 55.8 |
| CFAS - FIHS | Crisis | 221 | 23 |
| CFAS - FIHS | HMIS | 60 | 6.3 |
| CFAS - FIHS | CFAS - CIC | 37 | 3.9 |
| CFAS - FIHS | No Overlap | 15 | 1.6 |
| CFAS - CIC | CFAS - ANI | 164 | 79.6 |
| CFAS - CIC | DCR - ES | 119 | 57.8 |
| CFAS - CIC | CMS | 82 | 39.8 |
| CFAS - CIC | CFAS - FIHS | 37 | 18 |
| CFAS - CIC | Crisis | 37 | 18 |
| CFAS - CIC | HMIS | 28 | 13.6 |
| CFAS - CIC | No Overlap | 14 | 6.8 |
| MCSO - Arrest | MCSO - Booking | 2314 | 51.4 |
| MCSO - Arrest | DCR - ES | 1609 | 35.7 |
| MCSO - Arrest | No Overlap | 1275 | 28.3 |
| MCSO - Arrest | CMPD | 652 | 14.5 |
| MCSO - Arrest | Crisis | 386 | 8.6 |
| MCSO - Arrest | HMIS | 285 | 6.3 |
| MCSO - Arrest | CMS | 87 | 1.9 |
| MCSO - Arrest | INLIVIAN | 85 | 1.9 |
| MCSO - Arrest | GW | 31 | 0.7 |
| MCSO - Booking | No Overlap | 8938 | 59.8 |
| MCSO - Booking | DCR - ES | 4356 | 29.1 |
| MCSO - Booking | CMPD | 1708 | 11.4 |
| MCSO - Booking | Crisis | 1119 | 7.5 |
| MCSO - Booking | HMIS | 950 | 6.4 |
| MCSO - Booking | CMS | 287 | 1.9 |
| MCSO - Booking | GW | 158 | 1.1 |
| MCSO - Booking | HC | 71 | 0.5 |
| MCSO - Booking | INLIVIAN | 68 | 0.5 |
| MCSO - Booking | CFAS - ANI | 28 | 0.2 |
| House CLT | No Overlap | 81 | 80.2 |
| House CLT | DCR - ES | 10 | 9.9 |
| CMPD | No Overlap | 35811 | 80 |
| CMPD | DCR - ES | 7691 | 17.2 |
| CMPD | Crisis | 2414 | 5.4 |
| CMPD | HMIS | 884 | 2 |
| CMPD | CMS | 267 | 0.6 |
| CMPD | INLIVIAN | 266 | 0.6 |
| CMPD | GW | 241 | 0.5 |
| CMPD | HC | 115 | 0.3 |
| CMPD | CFAS - ANI | 10 | 0 |
| HC | No Overlap | 660 | 49.5 |
| HC | DCR - ES | 507 | 38 |
| HC | HMIS | 376 | 28.2 |
| HC | Crisis | 203 | 15.2 |
| HC | CMPD | 115 | 8.6 |
| HC | INLIVIAN | 59 | 4.4 |
| HC | GW | 26 | 1.9 |
| INLIVIAN | No Overlap | 3284 | 64.6 |
| INLIVIAN | DCR - ES | 1638 | 32.2 |
| INLIVIAN | Crisis | 465 | 9.1 |
| INLIVIAN | HMIS | 288 | 5.7 |
| INLIVIAN | CMPD | 266 | 5.2 |
| INLIVIAN | HC | 59 | 1.2 |
| INLIVIAN | CMS | 41 | 0.8 |
| INLIVIAN | GW | 35 | 0.7 |
| INLIVIAN | CFAS - ANI | 12 | 0.2 |
| LNA | DCR - ES | 66 | 47.5 |
| LNA | No Overlap | 63 | 45.3 |
| LNA | Crisis | 22 | 15.8 |

Appendix B - New Data Partners and Datasets
New Data Partners
In 2025, 15 more partners joined the Data Trust by either signing or re-signing their data sharing agreements. This includes both completely new partners and partners who were involved previously and have re-engaged. This also includes both partners who share data for the Explorer tools and/or individual-level administrative data. Forty-six percent (7) of new partners share individual-level administrative data and 53% (8) of new partners share data for the explorer tools. We focused on building partnerships in the environment and engagement domains. In 2025, we obtained four new partners in the environment domain and three new partners in the engagement domain, representing arts, culture, and science organizations.
The table below provides more information about the new data partners. The “New or Updated” column specifies if the partner is new to the Data Trust or whether they have re-engaged with the Data Trust after a time by resigning updated agreements. The “Data Type” column indicates if the partner is sharing individual-level administrative data or data for the explorer tools. The “Domain” column indicates the quality of life domain that aligns with the data partner. HMIS refers to agreements that only apply to data collected by agencies who provide services to people experiencing homelessness and who contribute to the Homeless Management Information System, or HMIS.
| Data Partner Name | Description | New or Updated | Data Type | Domain |
|---|---|---|---|---|
| Roof Above | Roof Above is a comprehensive homeless service provider serving 1,400 people per day through a spectrum of services ranging from street outreach, day services, emergency shelter, and permanent supportive housing. They unite communities to end homelessness, one life at a time. The agreement was for the SECU-Rise on Clanton data license request, where data about people residing at the Rise on Clanton was shared with the Data Trust to link with other data. | Updated (project-specific) | Integrated Administrative Data | Housing and Homelessness |
| Charlotte Heat Mappers | The Charlotte Heat Mappers aim to better understand the varying effects of extreme heat across our urban area and to work with local partners to mitigate its impacts on community health and wellbeing. Data from the 2024 heat mapping effort was shared for the Quality of Life Explorer | New | Explorer Data | Environment |
| Catawba Riverkeeper | Responsible for monitoring water quality in the Catawba River Basin. Shares swim guide water quality testing data. | New | Explorer Data/Other | Environment |
| Yadkin Riverkeeper | Responsible for monitoring water quality in the Yadkin River Basin. Shares swim guide water quality testing data. | New | Explorer Data/Other | Environment |
| Charlotte Bilingual Preschool | Provides high-quality bilingual education for preschool aged children in Charlotte-Mecklenburg | Updated (project-specific) | Integrated Administrative Data | Education |
| Haw River Assembly | Responsible for monitoring water quality in the Haw River Basin. Shares swim guide water quality testing data, and trash trap data | New | Explorer Data/Other | Environment |
| Charlotte Museum of History | The Charlotte Museum of History saves and shares the Charlotte region’s history, connecting the past to current issues and opportunities. Shares information about members and visitors. | New | Explorer Data | Arts and Culture |
| Mint Museum | Established in 1936, The Mint Museum is a leading, innovative cultural institution and museum of international art and design. Shares information about members and visitors. | New | Explorer Data | Arts and Culture |
| Medic | Medic provides emergency medical services and ambulance services to Mecklenburg County. The agreement was for the SECU-Rise on Clanton data license request, where data about people residing at the Rise on Clanton was shared with the Data Trust to link with other data. | New (project-specific) | Integrated Administrative Data | Health, Mental Health and Well-being |
| Levine Museum of the New South | Over thirty years ago, Levine Museum of the New South was founded as a history museum that tells everyone’s story and confront difficult issues with historical context. Shares information about members and visitors. | New | Explorer Data | Arts and Culture |
| DreamKey Partners | DreamKey Partners, Inc, is a private, nonprofit real estate development and finance corporation that addresses affordable housing holistically. DreamKey Partners develops real estate including rental and homeowner units; administers programs to support households such as homeownership education and counseling, down payment assistance and lending, and emergency assistance; and conducts strong community engagement. | New | Integrated Administrative Data | Housing and Homelessness |
| Ada Jenkins Center | Ada Jenkins Center serves people in and around Cornelius, Davidson, and Huntersville communities to create lasting solutions for economic stability. | New | Integrated Administrative Data | Housing and Homelessness; |
| Novant Health | Novant Health is an integrated network of hundreds of medical facilities providing a seamless and personalized healthcare experience for communities across North Carolina and South Carolina. The agreement was for the SECU-Rise on Clanton data license request, where data about people residing at the Rise on Clanton was shared with the Data Trust to link with other data. | Updated (project-specific) | Integrated Administrative Data | Health, Mental Health and Well-being |
New Data
In 2025, we gained 14 new datasets. Six datasets contain aggregate or spatial data to be used on the Explorer tools or for other research. Four of these datasets are related to the environment domain and allow us to better understand water quality and heat in our region. Two of these datasets are related to the arts and culture domain and are part of work associated with re-building an arts and culture variable on the Quality of Life Explorer.
Seven of the new datasets contain individual level data to be linked in the Data Trust. We obtained six new datasets from Mecklenburg County Child, Family, and Adult Services from their Services for Adults Division. We also obtained new data from Lakeview Neighborhood Alliance. The new data is described in the table below. The “Dataset / Variable” column indicates whether the new data is an entire new dataset or new variables to an existing dataset. The “Domain” column indicates the quality of life domain that aligns with the dataset. Detailed information about all data available at the Data Trust can be found here.
| Data Partner | Data Description | Dataset / Variable | Domain |
|---|---|---|---|
| Mecklenburg County Child, Family, and Adult Services - Services for Adults | The Services for Adults data contains 5 datasets related to serving seniors in Mecklenburg County. Those datasets include: Meck Transportation SCNP Homebound and Congregate Adult Protective Services Guardianship In Home Aid Adult Day Care The Data Trust is in the process of loading the datasets and they should be represented in next year’s report. | Dataset | Safety and Justice; Economy and Work; Health, Mental Health and Well-being |
| Lakeview Neighborhood Alliance | Data about residents who participate in the Lakeview Universal Basic Income gift card program. Also includes a resident wellbeing survey. | Dataset | Economy and Work |
| Yadkin Riverkeeper | Swim guide data - data about water quality collected throughout the summer. Also has data about trash collected from the rivers. | Dataset | Environment |
| Haw River Assembly | Swim guide data - data about water quality collected throughout the summer. Also has data about trash collected from the rivers. | Dataset | Environment |
| Catawba Riverkeeper | Swim guide data - data about water quality collected throughout the summer. Also has data about trash collected from the rivers. | Dataset | Environment |
| Mint Museum | Aggregate data about visitors and members. | Dataset | Arts and Culture |
| Medic | Data about patients meeting specific criteria to match to the residents at the Rise on Clanton. | Dataset (project-specific) | Health, Mental Health and Well-being |
| Levine Museum of the New South | Aggregate data about visitors and members. | Dataset | Arts and Culture |
| Charlotte Heat Mappers | Aggregate data about heat index, to go on Quality of Life Explorer | Dataset | Environment |

Appendix C - Data Use Summaries
The Institute and Data Trust maintains a community data infrastructure so that the data can be used for community benefit, specifically through research, evaluation and planning. All data is de-identified before release. As a resource to both the community and the University, we engage researchers who are based in our local government and nonprofits, as well as academic researchers doing community-engaged research and advancing knowledge in the nine domains we address. This section details the use and impact of the Explorer tools, the ways in which Data Trust data were used, the projects completed by Institute researchers, and engagements by the Institute and Data Trust in 2025.
More details about each project are below. Contact DataTrust@charlotte.edu with any questions.
Data License Requests
Quality of Life Explorer 2025 Update
| Project Lead and Organization | Katie Zager, Charlotte Urban Institute |
|---|---|
| Project Description | Annual request to update variables on the Quality of Life Explorer. |
| Domain(s) | Education; Economy and Work |
| Data Requested and Linked | Addresses geocoded to the Neighborhood Profile Area for the following variables: DCR -ES (September 2024) Recipients of Food and Nutrition Services CMS (2023/24) Graduation rate Student attendance (to calculate student absenteeism) Test proficiency in elementary, middle and high school Neighborhood school attendance |
Evaluation of the Lakeview Guaranteed Basic Income Program
| Project Lead and Organization | Drew Reynolds, PhD, Common Good Data, LLC |
|---|---|
| Project Description | This project seeks to demonstrate the impact of the Guaranteed Basic Income Program at Lakeview Neighborhood Alliance beyond immediate economic relief. This study is being conducted in the context of research on policies related to universal basic income (UBI) and cash transfer programs. Understanding the potential impact of the gift card program will inform decision-making for both Lakeview Neighborhood Alliance as well as other entities interested in supporting the economic mobility of residents living in concentrated poverty. |
| Domain(s) | Education; Economy and Work; Safety and Justice; Housing and Homelessness |
| Data Requested and Linked | This project was the first use of data from Lakeview Neighborhood Alliance as a new Data Partner of the Data Trust. Residents of Lakeview and recipients of the gift cards were linked with other data at the Data Trust. The Data Trust created two comparison groups - one for adults and one for children. The datasets and years requested are below: CMS: 2019/20-2024/25 DCR - ES: 2019-2024 HMIS: 2019-2024 GW: 2019-2024 Crisis: 2019-2024 MCSO - Booking: 2019-2024 CFAS - ANI: 2019-2024 |
Assessing the role of peer support specialists in housing stability using the homeless management information system: A retrospective matched cohort study
| Project Lead and Organization | Lindsay Miller, UNC Charlotte Health and Human Services |
|---|---|
| Project Description | The purpose of this study is to understand the relationship between the implementation of Peer Support Specialists (PSS) and re-entry to homelessness services among people in Mecklenburg County, NC. People experiencing homelessness have reported increases in their quality of life, social support, and greater physical and mental health when exposed to PSS, however little is known about the use of PSS among people who have recently exited homelessness. The aim of this study is to explore the association between people who transition to permanent housing programs that offer peer support services and their housing stability compared to those who are in housing programs without peer support, controlling for covariates. |
| Domain(s) | Housing and Homelessness |
| Data Requested and Linked | This project used data from HMIS, only for years 2019-2023. |
SECU - The Rise on Clanton
| Project Lead and Organization | Eric Moore, PhD and Jenny Hutchison, PhD, Charlotte Urban Institute |
|---|---|
| Project Description | The intent of this project is to examine the effects of housing individuals experiencing homelessness in a new residential living building – SECU The Rise on Clanton – managed by Roof Above. This will be a multi-phase project, with the objectives of the first phase consisting of the following: Describe the residents of The Rise, including demographics and previous experiences with homelessness. Describe the resident’s use of local support services, criminal justice involvement, and healthcare utilization. Determine the feasibility of a comparison group for the second phase and reach an agreement with Roof Above on the research design. |
| Domain(s) | Housing and Homelessness; Safety and Justice; Health, Mental Health and Well-being; Economy and Work |
| Data Requested and Linked | For this project, an external dataset was shared by Roof Above that contained information about the residents of The Rise on Clanton. This data was then linked with other data at the Data Trust. This project also included two health datasets from Novant Health and Medic. The requested datasets and years requested are below: HMIS: 2020-2024 DCR - ES: 2020-2023 MCSO - Booking: 2020-2023 CMPD: 2020-2023 Atrium/Advocate Health: 2020-2023 |
State of Our Data 2025
| Project Lead and Organization | Project Leads: Sydney Idzikowski and Nick Occhipinti, UNC Charlotte Urban Institute/Data Trust |
|---|---|
| Project Description | The purpose of this project is to understand the groups represented within and across partner agency datasets at the Charlotte Regional Data Trust and how those groups may or may not be proportionality representative of the Mecklenburg County population. The groups that are available across data partner data are race, ethnicity, age, and gender. As available, other groups may also be included such as disability status, veteran status, immigrant, and geography (zip code). This project will also seek to understand how people are linked between the each of the data partners. This project will cumulate in the Data Trust’s annual State of Our Data Report. |
| Domain(s) | Housing and Homelessness; Safety and Justice; Economy and Work; Education |
| Data Requested and Linked | This project requests data from all regular data partners of the Data Trust. It is updated annually. The requested datasets and years requested are below: Crisis: 2016-2024 CMS: 2015/16-2023/24 DCR – ES:, 2016-2024 CFAS – ANI: 2016-2024 CFAS – FIHS: 2016-2024 CFAS – CIC: 2016-2024 GW: 2020-2024 HMISL 2016-2024 MCSO – Bookings: 2016-2024 MCSO: Arrest: 2016-2022 Habitat - Homeowner: 2017 - 2024 Habitat CHR: 2017 - 2024 HC: 2020-2024 House CLT: 2016-2024 CMPD: 2016-2024 INLIVIAN:, 2017-2024 |
Understanding how Charlotte Bilingual Preschool Prepares Dual Language Learners for Success in Elementary School
| Project Lead and Organization | Project Lead: Drew Gadaire, PhD, UNC Charlotte Department of Psychological Sciences |
|---|---|
| Project Description | This study will utilize archival data from the Charlotte Regional Data Trust to understand how Charlotte Bilingual Preschool graduates’ engagement, academic performance, and behavior in Kindergarten through 5th grade compare to that of Latinx students in a matched comparison group, who did not attend a dual language preschool program. Additionally, this study will examine how the engagement and experiences of students and families at Charlotte Bilingual Preschool relate to students’ engagement, academic achievement, and behavior in elementary school. Study findings will inform Charlotte Bilingual Preschool’s continuous quality improvement efforts, enhance understanding of the effects of high-quality dual language immersion ECE programs, and inform future early childhood programs and policies to prepare DLLs from Spanish-speaking households for success in elementary school and beyond. |
| Domain(s) | Education |
| Data Requested and Linked | For this project, an external dataset was provided by Charlotte Bilingual Preschool and matched with CMS data. The requested datasets and years requested are below: CMS: 2018/19-2024/25 |
Project BOOST Retrospective Outcomes Analysis
| Project Lead and Organization | Annelise Mennicke, PhD, UNC Charlotte School of Social Work |
|---|---|
| Project Description | Project BOOST is a hospital-based violence intervention program (HVIP). The goal of HVIPs is to reduce youth/young adult involvement in violent incidents, which can be monitored through readmission to the hospital. However, hospital readmissions alone cannot fully capture involvement in violent incidents. There is a need to evaluate the effectiveness of Project BOOST on violent incidents and social outcomes using data available from other sources. Specifically, Project BOOST participants could be monitored for engagement with other systems. The goal of this project is to use the Charlotte Data Trust to link data across systems to assess outcomes associated with Project BOOST participants. Specifically, we will investigate violent recidivism and social determinants of health outcomes across systems (e.g., law enforcement, child welfare, schools). |
| Domain(s) | Safety and Justice; Health, Mental Health and Well-being; Housing and Homelessness; Economy and Work |
| Data Requested and Linked | For this project, an external dataset was provided by Advocate Health. This dataset included people who are referred to Project BOOST and either participated or declined participation. The dataset also includes a social drivers of health screening. This data is linked with other data at the Data Trust. Additionally, a custom dataset from HMIS was provided for this project. The requested datasets and years requested are below: CMS: 2021/2022 - 2023/2024 Crisis Assistance Ministry: 2022-2024 HMIS: 2022-2023 CFAS - FIHS: 2022-2024 CF AS - ANI: 2022-2024 DCR - ES: 2023-2024 CMPD : 2022 HC: 2022-2024 MCSO - Booking 2022-2024 GW: 2022 HMIS CUSTOM (Supplemental tool): 2022-2024 HMIS CUSTOM (TAY-VI_SPDAT V2): 2022-2024 |
The Role of Social Services in Reducing Housing Instability: A Local Analysis in Charlotte, North Carolina
| Project Lead and Organization | Clysha Whitlow, PhD student, UNC Charlotte Department of Psychological Services (Dr. Andrew Gadaire, supporting faculty) |
|---|---|
| Project Description | This study investigates whether breadth of multi-service contact, defined as interaction with two or more distinct service systems, is associated with variation in repeated housing-related service system contact using administrative data sources that capture system-observed housing crisis contact over time. Using a bioecological frameWork (Bronfenbrenner, 1979), the study explores how the interplay between institutional service systems, neighborhood contexts, and household-level characteristics is associated with patterns of housing-related system contact over time. Rather than evaluating the performance or effectiveness of individual agencies or programs, the study focuses on system level service exposure and coordination patterns and their associations with repeated contact with housing crisis–oriented service systems, without making causal claims about housing outcomes or stability. |
| Domain(s) | Housing and Homelessness; Economy and Work |
| Data Requested and Linked | This projects requested all people who identified as Black or African American, alone or in combination with another race or ethnicity. The requested datasets and years requested are below: Crisis Assistance Ministry: 2015-2024 HMIS: 2013-2024 HC: 2017-2024 DCR - ES: 2013-2024 |
Completed Projects
The list below details the projects completed at the Institute and Data Trust. x projects were completed in 2025. The projects largely explored the housing and homelessness, safety and justice, and economy and work domains. Two projects were completed by researchers outside the Institute. More than half (54%, n=6) used linked administrative data from the Data Trust. Links to the reports are provided as available.
Student Emergency Fund - An Exploratory Analysis of Community Connections
| Project Lead and Organization | Ellissa Brooks Nelson, PhD, UNC Charlotte Division of Student Affairs |
|---|---|
| Released | January 2025 |
| Project Description | The Vice Chancellor for UNC Charlotte’s Division of Student Affairs requested that Student Affairs Research and Assessment take a deeper look into our students who request Student Emergency Funds (SEF). This project identified whether students who request SEF are receiving (or received in the past) selected community resources or have had interactions with selected agencies outside of the university. You can read findings here. |
| Used Data Trust Data | Yes |
| Domain(s) | Education; Housing and Homelessness; Economy and Work; Safety and Justice |
Quality of Life Explorer 2025 Update
| Project Lead and Organization | Katie Zager, Charlotte Urban Institute |
|---|---|
| Released | March 2025 |
| Project Description | Annual request to update variables on the Quality of Life Explorer. |
| Used Data Trust Data | Yes |
| Domain(s) | Education; Economy and Work |
Examining Educational Outcomes for Children Involved in Foster Care
| Project Lead and Organization | Robert Pinka, PhD, Council for Children’s Rights |
|---|---|
| Released | March 2025 |
| Project Description | This project investigated educational outcomes of school-aged youth involved in the foster care system. The project used comparison groups of children in CMS experiencing homelessness and students who are neither homeless nor in foster care. |
| Used Data Trust Data | Yes |
| Domain(s) | Education; Economy and Work; Safety and Justice |
Transition age foster care youth and housing instability
| Project Lead and Organization | Bridget Anderson and Jenny Hutchison, Ph.D., UNC Charlotte Urban Institute |
|---|---|
| Released | June 2025 |
| Project Description | This project examined the total prevalence of homelessness among foster-care youth and youth who participated in the Extended Foster Care program. The project reported on risk and protective factors for homelessness. This project was part of the State of Housing Instability and Homelessness Report series. You can read results here. |
| Used Data Trust Data | Yes |
| Domain(s) | Housing and Homelessness; Safety and Justice; Economy and Work |
Understanding proportionality and representation in Data Trust datasets
| Project Lead and Organization | Sydney Idzikowski, Charlotte Urban Institute |
|---|---|
| Released | June, 2025 |
| Project Description | This project was the initial data request for the annual State of Our Data Report. The report serves at the annual report for the Data Trust shows who is represented in the data, how people are linked across datasets, and how the data are used. You can read previous reports here. |
| Used Data Trust Data | Yes |
| Domain(s) | Education; Housing and Homelessness; Economy and Work; Safety and Justice |
The Influence of Tutoring Services on Elementary Students Below Grade Level Math
| Project Lead and Organization | Eric Moore, Ph.D., UNC Charlotte Urban Institute |
|---|---|
| Released | June 2025 |
| Project Description | The project evaluated the effectiveness of Heart Math Tutoring (HMT). HMT is a math tutoring program that Works with dedicated volunteers to help elementary students develop foundational math skills. The project examined if there are differences between in academic performance between students who receive tutoring through HMT and those who do not; whether the tutoring method and/or number of tutoring sessions affected academic performance. |
| Used Data Trust Data | Yes |
| Domain(s) | Education; Economy and Work |
Good Jobs Charlotte - Work Development
| Project Lead and Organization | Eric Moore, Charlotte Urban Institute |
|---|---|
| Released | December 2025 |
| Project Description | This project sought to improve the understanding of local Work development clients and their needs. The project examined the data that are collected by Work agencies; the extent to which clients access Work agencies; and what other community services do clients of Work agencies engage with. This study focused on a critical issue: the fragmented nature of Work development data. The project connected various information strands by highlighting this disjointed data environment, forming a unified representation that illustrates the challenges and opportunities within the local Work landscape. |
| Used Data Trust Data | Yes |
| Domain(s) | Economy and Work; Housing and Homelessness |
A Home for All
| Project Lead and Organization | Sydney Idzikowski, Charlotte Urban Institute |
|---|---|
| Released | June 2025 |
| Project Description | Via the United Way of Greater Charlotte, this project provided data capacity building and support for six agencies involved with the community-wide effort to end homelessness and housing instability in Charlotte-Mecklenburg. The data capacity building will support the evaluation of the Initiative and help to ensure that high quality data is being collected ahead of, during, and after the evaluation. The Institute conducted in-depth assessments of the data practices at the organizations and offered recommendations to strengthen those data practices |
| Used Data Trust Data | No |
| Domain(s) | Housing and Homelessness |
Ascent Housing Impact Fund - Phase 1
| Project Lead and Organization | Jenny Niu , Charlotte Urban Institute |
|---|---|
| Released | April 2025 |
| Project Description | This project developed an evaluation framework to assess the overall influence of the Housing Impact Fund on the well-being of households within their communities. The evaluation framework prioritizes the monitoring and measurement of long-term impacts of housing stability, as well as measurements related to the Community Health Worker and peer-parenting education programs. Phase 1 prepares the work of Phase 2, which will include data collection and an evaluation. |
| Used Data Trust Data | No |
| Domain(s) | Housing and Homelessness |
Sugar Creek Charter School TIMS Computerized Bus Routing
| Project Lead and Organization | Andrew McComery , Charlotte Urban Institute |
|---|---|
| Released | June 2025 |
| Project Description | The Institute’s TIMS staff assisted Sugar Creek Charter with training and software/data support services within the existing TIMS computerized bus routing software. |
| Used Data Trust Data | No |
| Domain(s) | Transportation |
Alternatives to Violence 3 - Year Evaluation
| Project Lead and Organization | Angelique Gaines and Fatima Rodriguez Caba , Charlotte Urban Institute |
|---|---|
| Released | December 2025 |
| Project Description | The Institute evaluated the Alternatives to Violence program in Beatties Ford. This evaluation looked at three years of the program. Read the findings here. |
| Used Data Trust Data | No |
| Domain(s) | Safety and Justice |
Knight Foundation West End News Ecosystem
| Project Lead and Organization | Angelique Gaines, Charlotte Urban Institute |
|---|---|
| Released | July 2025 |
| Project Description | This project investigated news sources and engagement, the information ecosystem in Charlotte’s West End, and whether that information ecosystem is meeting the needs of residents and businesses. Read the findings here. |
| Used Data Trust Data | No |
| Domain(s) | Engagement |
Community Engagements
The Institute and Data Trust regularly engages with both the UNC Charlotte campus community and the larger community in the Charlotte Region. We also share our work and learn from others at conferences. Below we detail how the Institute and Data Trust engaged with the community and shared our work in 2025.
- 5 engagements with the UNC Charlotte Campus Community
- Faculty open house (urbanCORE explore)
- UNC Charlotte Community Engagement Showcase
- UNC Charlotte Center for Community, Heritage, and the Arts - Quality of Life Explorer presentation
- Levine Scholars - Quality of Life Explorer presentation
- Public Health Graduate students - Quality of Life Explorer presentation
- 10 engagements with the Charlotte Region Community
- The Institute + Data Trust participated in a “Data Day” with Piedmont Promise, an alliance of conservation and environmental organizations across the Piedmont of NC. The goal of the event was to introduce the organizations to the Data Trust, walk through data sharing agreements, and conduct a data inventory to explore the available data. Several UNC Charlotte faculty members were also in attendance to consider the potential research uses of the available data.
- Dr. Lori Thomas and Dr. Liz Morrell presented the Quality of Life Explorer at the County Manager’s request during a two-day Mecklenburg County Community Collaboration Planning Retreat, November 20-21, 2025. The presentation provided a framework for local leaders (including several Data Trust Board members) from across various sectors to think about developing goals and strategies for a countywide Quality of Life Scorecard under development by the Mecklenburg County Office of Strategy and Innovation.
- Sydney Idzikowski presented to the Charlotte Rotary Club about the Data Trust
- Sydney Idzikowski and Lori Thomas presented to the Charlotte-Mecklenburg Planning Commission about the Institute, Explorer tools, and Data Trust
- Hosted the 2025 Schul Forum
- Katie Zager presented the Quality of Life Explorer to the Mecklenburg County Internal Consultants
- Katie Zager and Angelique Gaines presented the Quality of Life Explorer and hosted a data walk with the Mecklenburg County Criminal Justice Services Youth Leadership Board
- Katie Zager presented the Quality of Life Explorer to the Camino Research Institute
- Katie Zager and Asha Ellison trained Charlotte-Mecklenburg librarians and other library staff on how to use the Quality of Life Explorer and share with the community.
- Regular use of and presentations to the community about the Quality of Life Explorer, including regular use by the Innovation Incubator Project.
- 16,834 visitors to the Quality of Life Explorer, roughly the same as last year.
- Our research/data was featured by 10 media outlets, in 5 publications and garnered 33 media mentions
- Had a successful first year of the Impact, Data, and Evaluation Academy, helping 96 unique organizations from nonprofits, to social impact organizations, to universities, to government agencies build internal capacity around data and evaluation.
- Featured on 2 podcasts:
- Mecca Howe and Sydney Idzikowski talked about the importance of data on the Queen City Green podcast
- Sydney Idzikowski talked about ethical data use and governance on the Common Good Data podcast.
- Mecca Howe and Sydney Idzikowski talked about the importance of data on the Queen City Green podcast
- 11 conference presentations and other engagements
- Hosted the 2025 National Neighborhood Indicators Partnership (NNIP) meeting in Charlotte. Worked in collaboration with NNIP to organize the annual meeting. Dr. Lori Thomas, Sherri Chisholm along with Laura Yates Clark and Tonya Jameson conducted the opening session on how economic mobility has shaped Charlotte for the past 10 years at the annual meeting of the National Neighborhood Indicators Partnership (NNIP), a national technical assistance network of the national Urban Institute, held in Charlotte, Sept. 10-12. Institute staff members Sydney Idzikowski, Dr. Liz Morrell, and Asha Ellison and UNC Charlotte faculty members Dr. Katherine Idziorek and Dr. Alicia Dahl were also featured in sessions throughout the meeting.
- The Data Trust is featured in two case studies in the recent release of Actionable Intelligence for Social Policy’s Toolkit for Centering Racial Equity throughout Data Integration.
- Dr. Lori Thomas and Jamaal Kinard along with Deja Kemp, Director of Legal Policy for Actionable Intelligence for Social Policy (AISP), led a breakout session entitled “Building a Model for Data + Equity + Community in Charlotte” at GEO 2025 Learning Conference in Charlotte on May 5.,
- Dr. Lori Thomas and Associate Director Sydney Idzikowski are leading a panel “Centering Community Voice in the Ethical Governance and Use of Data” at the ADRCon (Administrative Data Research Conference) 2025 - Data For Public Good in Washington DC - June 23-25.
- Dr, Lori Thomas is co-PI on a recently awarded National of Science Foundation (NSF) grant Collaborative Research: The Charlotte Data Science Corps - Cross-Institutional Flexible Pathways and Immersive Community Capacity Building.
- Dr. Lori Thomas joined the Executive Committee for the Consortium of University Public Service Organizations (CUPSO) as Vice-President. She continues to co-lead a national workgroup on university F&A practices with Mavis Asiedu-Frimpong, JD at the Senator Walter Rand Institute at Rutgers University, Camden.
- Dr. Lori Thomas and Sydney Idzikowski participated on a national webinar entitled, Southern Data Infrastructure: Past Lessons, Current Gaps, Future Opportunities hosted by the Southern Economic Advancement Project (SEAP) and the Louisiana Public Health Institute (LPHI) on December 8, 2025.
- The Data Trust hosted a Data Trust Dialogue about AI with board and committee members, facilitated by Barbie Bigelow.
- Group attended PACE Conference (Byron White, Tamara Johnson, Holly Middleton, Julia Meyarzum, Toye Watson, Kennicia Fortson, Heather Coffey, Erin Washburn, and community partner Rickey Hall)
- Attended CUMU (Coalition of Urban and Metropolitan Universities) - Fatima Rodriguez Caba, Tamara Johnson
- Tamara Johnson is on the editorial board for Gateways Journal
- Hosted the 2025 National Neighborhood Indicators Partnership (NNIP) meeting in Charlotte. Worked in collaboration with NNIP to organize the annual meeting. Dr. Lori Thomas, Sherri Chisholm along with Laura Yates Clark and Tonya Jameson conducted the opening session on how economic mobility has shaped Charlotte for the past 10 years at the annual meeting of the National Neighborhood Indicators Partnership (NNIP), a national technical assistance network of the national Urban Institute, held in Charlotte, Sept. 10-12. Institute staff members Sydney Idzikowski, Dr. Liz Morrell, and Asha Ellison and UNC Charlotte faculty members Dr. Katherine Idziorek and Dr. Alicia Dahl were also featured in sessions throughout the meeting.
- 4 peer-reviewed presentations:
- Hall, R., Hammelman, C., & Watson, T. (2025, February 12). Building impactful community-university partnerships through a shared power approach [Conference presentation]. 2025 Pathways to Achieving Civic Engagement (PACE) Conference, Greensboro, NC, United States.
- Idziorek, K., Jason, K., McCully, M., & Watson, T. (2025, September). Beyond boundaries: Advancing the urban mission through innovation, equity, and community partnership [Conference presentation]. 30th Annual Coalition of Urban and Metropolitan Universities (CUMU) Conference, Baltimore, MD, United States.
- Morrell, E. (2025, November). The Black Progress Effect in the Charlotte Region: Insights from Chetty’s 2023 Economic Mobility Study. 2025 Southeastern Division of the American Association of Geographers Conference, Lexington, KY.
- Howe, M., Wiley, A., & Venier, M. (2025, March 12). Silicone Wristbands: A noninvasive method for measuring chemical exposure & opportunities for human biological research. 2025 Human Biology Association Annual Meetings, Baltimore, Maryland, 50th anniversary “Over the Horizons” session.
- Hall, R., Hammelman, C., & Watson, T. (2025, February 12). Building impactful community-university partnerships through a shared power approach [Conference presentation]. 2025 Pathways to Achieving Civic Engagement (PACE) Conference, Greensboro, NC, United States.
Footnotes
https://ui.charlotte.edu/our-work/charlotte-regional-data-trust/↩︎
Habitat for Humanity for the Charlotte Region, Mecklenburg County Sheriff’s Office and Mecklenburg County Department of Social Services share more than one distinct dataset with the Data Trust. Depending on the analysis, they may be described as one organization or as a specific dataset.↩︎
When possible, data partner datasets are provided for dates 1/1/2025-12/31/2025. For Charlotte-Mecklenburg Schools, the 2024/2025 school year is the most recent school year used in this report. Goodwill Industries of the Southern Piedmont data begins 1/1/2020. MCSO - Arrest ends 4/30/2022. MCSO - Booking ends 12/31/2024. For more information see Appendix A.↩︎
Mecklenburg County Sheriff’s Office - Booking and Arrest and Lakeview Neighborhood Alliance are not included because we don’t have 2025 data from the Sheriff’s Office and Lakeview Neighborhood Alliance was not included in last year’s report.↩︎
Note the datasets within child welfare and criminal justice reflect many of the same people and may account for the slight increase in the share of people who are represented in three or more datasets.↩︎
2025 is used for all data partners except MCSO - Arrest (2022) and MCSO - Booking (2024) due to data availability.↩︎